What makes an area boom?
While plenty of factors play a role, there are three powerful traits that all booming markets share but are not widely discussed. Understanding these key indicators can help you spot the next big growth opportunity before it happens.
In this blog, we’ll reveal what they are, why they matter, and how they shape high-pressure markets. Ready to discover the top three traits that define a booming market? Let’s go!
Trait 1: Short/Shorter Time on Market
Without competition, there is no capital growth, and without capital growth, there are no booms.
But how can you tell if a market is highly competitive? One of the key indicators is sale days on market (DOM) – the number of days a property is listed for sale before it goes under contract. A low DOM often signals a hot, competitive market where buyers quickly snap up properties. Meanwhile, a high DOM typically points to a sluggish market with less demand. Let’s break it down into some examples where market pressure is high.
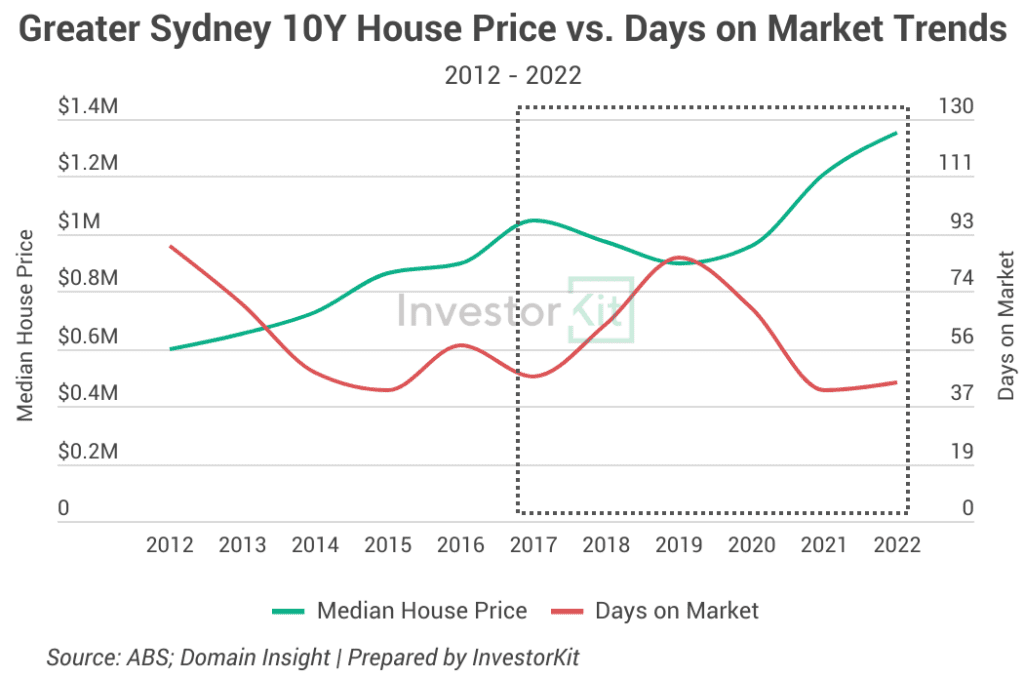
Between 2012 and 2015, Sydney experienced one of its most intense periods of capital growth, with momentum continuing to 2017 before the market eventually cooled. The competition among buyers was high and DOM declined dramatically.
- In 2013, properties spent an average of 70 days on the market – a 21% drop from the previous year. DOM fell even further to 48 days in 2014, marking another 31% reduction and bottomed out at 42 days in 2015.
- As the boom came to an end, DOM rose. Homes took an average of 64 days to sell in 2018 (up by 36% compared to the previous year) and 85 days in 2019 (up by 33% compared to last year).
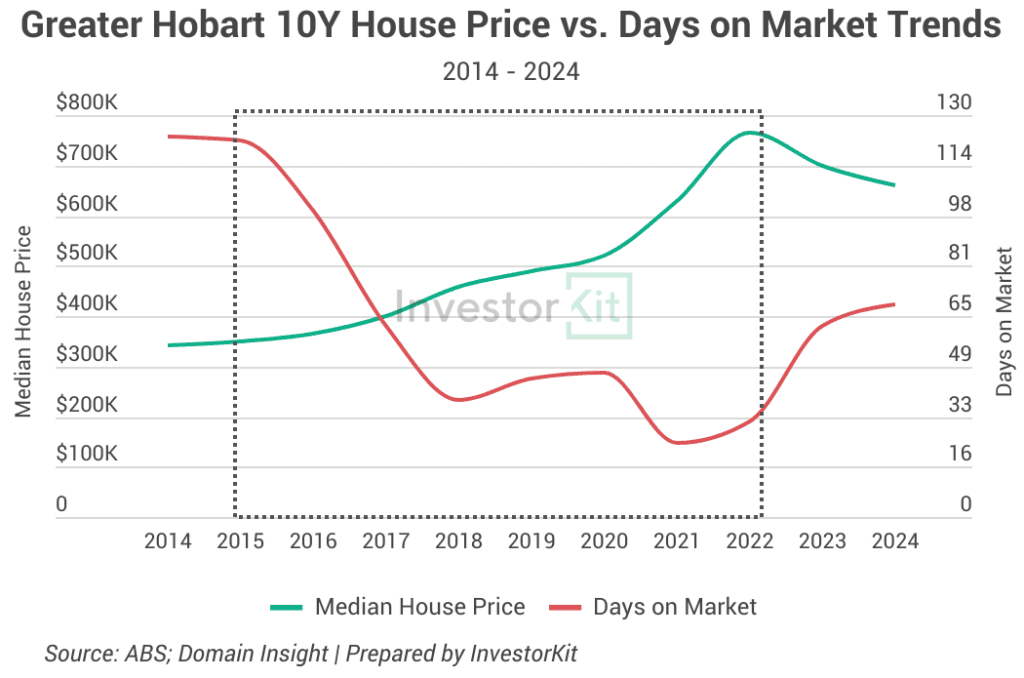
The same patterns can be seen in any other cities. Hobart, for example, during its two major booms from 2016 to 2018 and 2020 to 2022, DOM dropped significantly and remained low.
- In 2015, DOM was at a very high level of 122 days. However, as the market heated up, this number dropped to 99 days in 2016, 62 days in 2017, and just 38 days in 2018.
- The most intense period occurred between 2020 and 2022 when DOM hit a record low of 24 in 2021 and 31 in 2022.
- After this frenzied price growth, the market began to ease in the following years, and we saw DOM climbing.
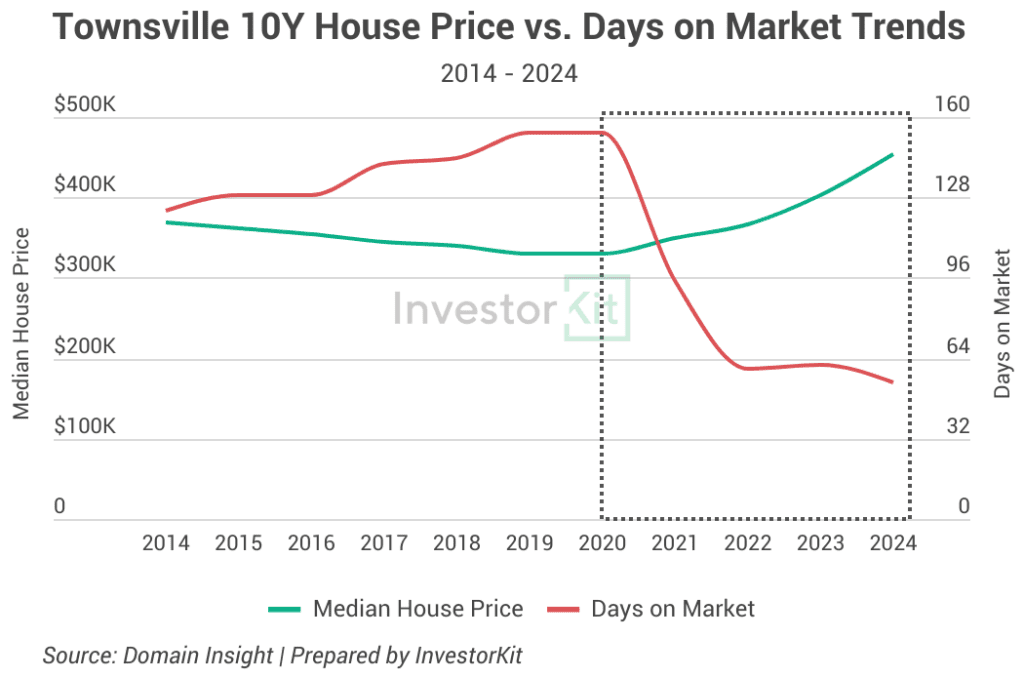
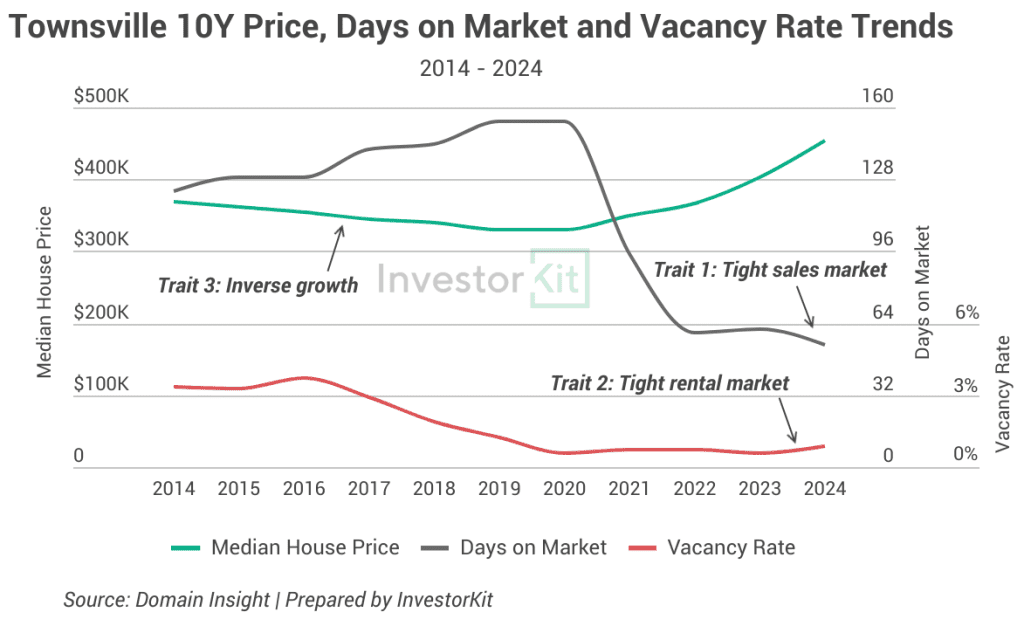
Not only major cities, small ones also experienced similar trends. Take Townsville, for example.
- Between 2014 and 2020, Townsville experienced its weakest period of growth when house prices continuously dropped. During this downturn, properties took significantly longer to sell, with DOM rising from 123 days in 2014 to a peak of 154 days in 2020.
- Nevertheless, from 2021, the city saw a dramatic change when DOM plunged to 98 days (down by 36% over the last year), and house prices began increasing. In 2024, DOM fell to a historic low of 54 days, and house prices skyrocketed.
A sharp decline in DOM – especially a drop of 30% or above – is a strong signal that a market boom could happen. However, it’s not only about the isolated number; the real insight comes from analysing its trajectory. Look at the past and current DOM trends and the overall direction to get the most accurate read on market heat.
Trait 2: Low Vacancy Rate
Even though DOM is one of the deciding metrics, it’s not the sole factor in predicting a market boom. Other metrics come into play, one of which is the vacancy rate—the percentage of unoccupied rental properties in a specific area at a given time.
However, vacancy rate alone doesn’t determine whether a boom will occur; instead, it is an overlaying indicator. Why? Because while low vacancy rates can exist in non-booming markets, high vacancy rates are never present in booming markets.
A boom is unlikely if rental pressure is low, as evidenced by high vacancy rates and stagnant and unpromising rental growth, even when other factors—such as low and declining DOM, tight inventory, low vendor discounts, and constrained supply—point to market strength. For a boom to occur, both the sales and rental markets must be tight across all levels.
Perth provides a clear example of this dynamic. During its boom period in 2023 and 2024, vacancy rates were exceptionally low, ranging between 0.5% and 0.8%. In contrast, vacancy rates were significantly high during its weakest period between 2014 and 2019. From 2013, they climbed rapidly from under 1% to a peak of 5.5% in 2016. From 2017, they started declining but were still much higher than the benchmark level (2%) until 2020.
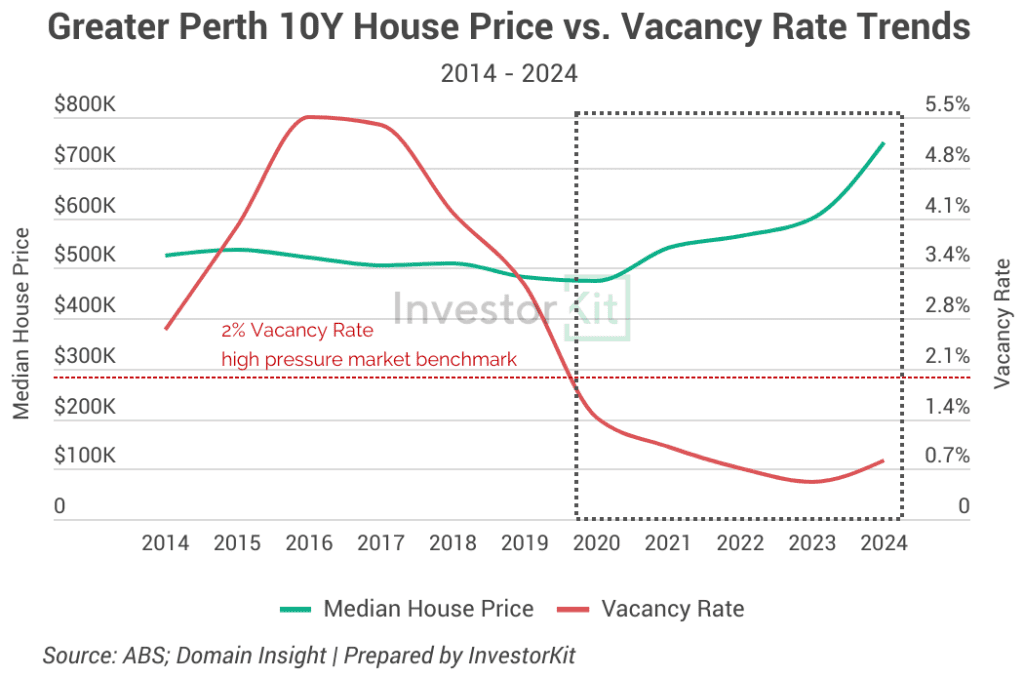
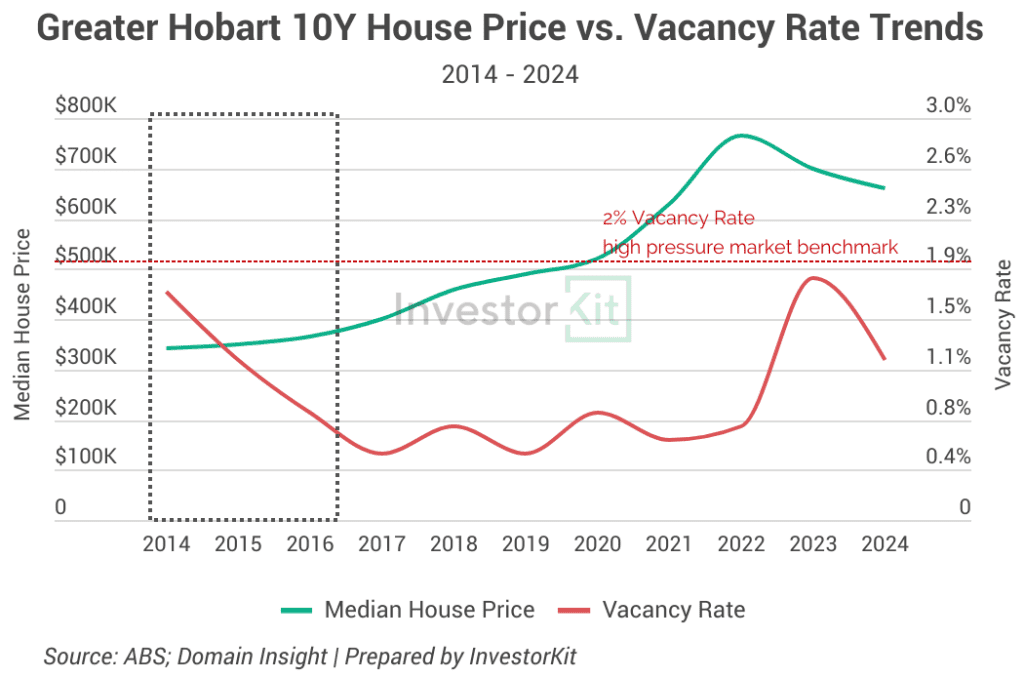
As mentioned above, low vacancy rates don’t always indicate a booming market. For instance, between 2014 and 2016, Hobart experienced moderate growth despite relatively low and declining vacancy rates.
Trait 3: Inverse Growth
Markets cannot underperform indefinitely. If market pressure and rental pressure are both getting tighter in a market, but the growth is slow, it may be on the verge of a boom.
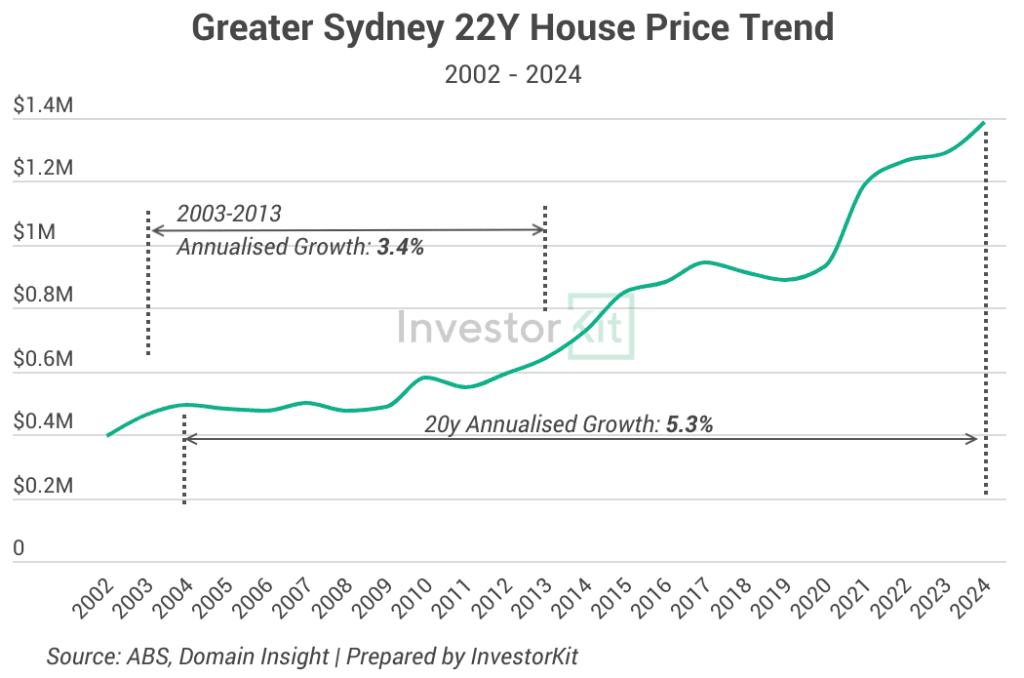
Take Sydney as an example. From 2002 to 2012, the city’s total growth was low (around 44%). However, from 2013 to 2023, its 10-year growth was remarkable (around 102%).
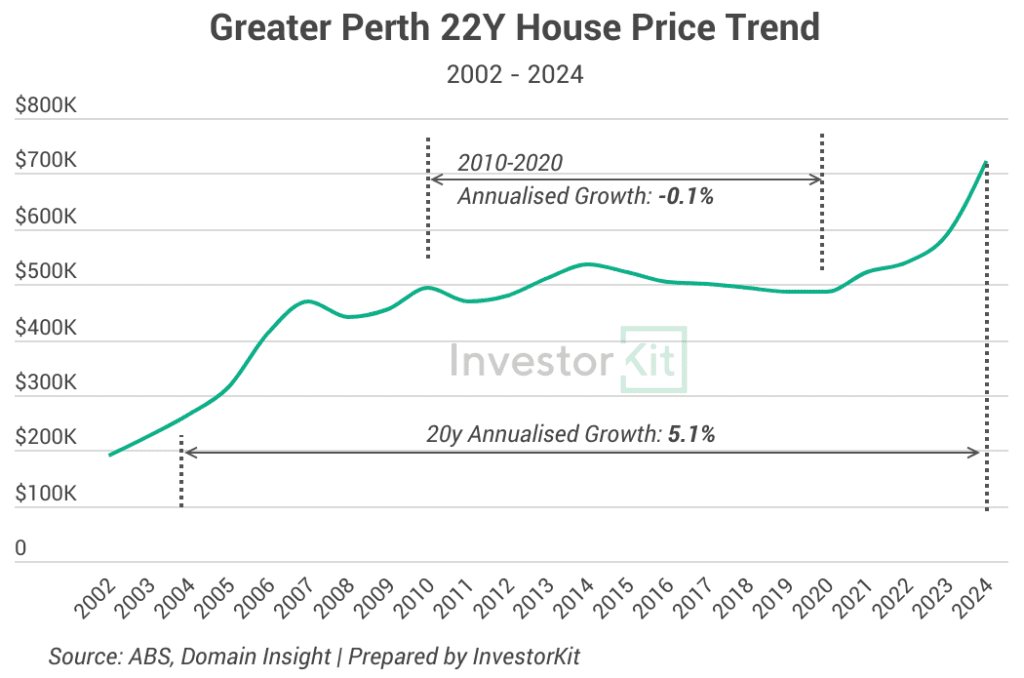
A similar trend happened in Perth. Before entering a booming phase between 2022 and 2024, it saw inverse growth (around -2%) from 2010 to 2020.
It is not straightforward that a weak 10-year growth will guarantee a high following 10-year growth. However, the market, indeed, tends to return to its long-term growth rates eventually. Historically, more than 90% of Local Government Areas in Australia over the last 25 years have achieved average compounding growth rates of around 5% or more. This means markets go through cycles of booms and downturns, but most eventually stabilise around their long-term averages.
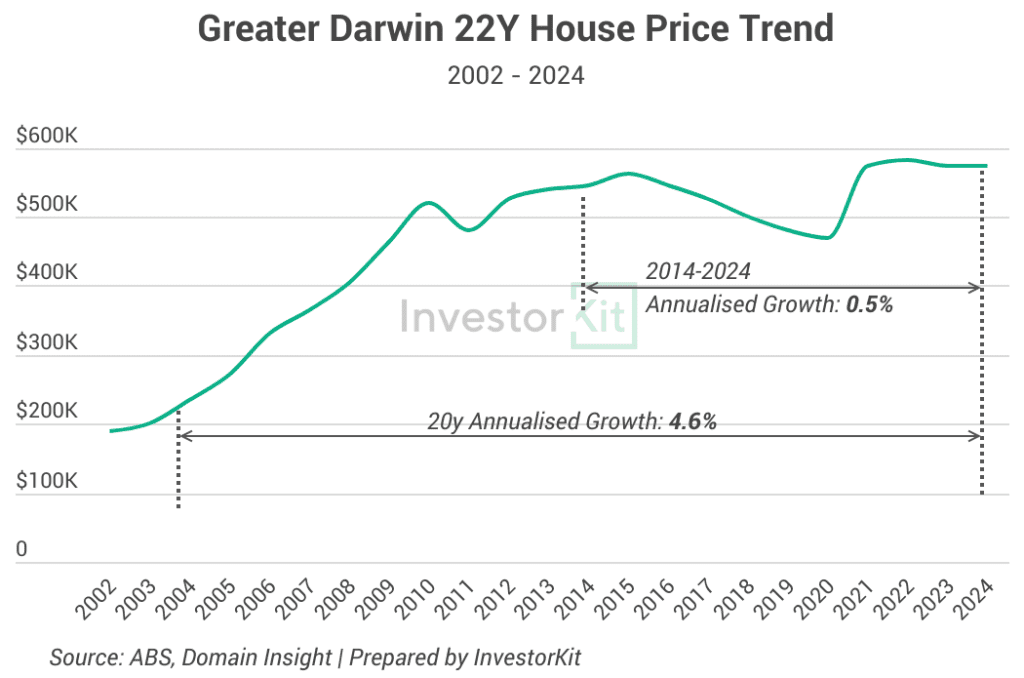
Darwin, for instance, grew tremendously between 2003 and 2014, followed by a prolonged period of stagnation. Yet, despite its recent underperformance, Darwin’s long-term annualised growth rate over the past 20 years still stands at 4.6%.
To wrap up, let’s look at Townsville – a current hot spot – where all three key traits are present: high market pressure, a tight rental market, and inverse growth over the past decade. Since 2021, Townsville has entered its booming phase, driven by an increasingly competitive sales market (low and declining DOM) and a tight rental market (low vacancy rate). Before this boom, the region faced a prolonged slump, with high DOM, elevated vacancy rates, and a weak 10-year growth.
In short, a booming market typically has these three key traits:
- High sales market pressure – Days on Market (DOM) is a leading indicator, and a steady decline often signals rising demand.
- Tight rental market pressure – Vacancy rate acts as an overlaying indicator; low vacancy suggests strong rental demand.
- Inverse growth – Markets that have underperformed for years often revert to long-term growth trends, creating potential for future booms.
Focusing on these traits while assessing potential growth can help you better anticipate market shifts and make informed decisions.
This blog is inspired by InvestorKit podcast episode, “All Boom Suburbs Share These 3 Factors”. Don’t miss this episode if you wish to understand better how areas experience periods of booms. Tune in now by clicking here!
InvestorKit is a data-driven buyers agency dedicated to helping property investors identify and invest in high-pressure markets and scale up their portfolios faster. Would you like to accelerate portfolio growth and invest like a pro? Click here to request a free, no-obligation 15-minute discovery call!
.svg)
