Does Renter Percentage Matter for Property Growth?
Many investors prefer buying in regions where there are fewer rental properties.
It sounds reasonable – at least you’ll have fewer competitors on the rental market, but “sounds reasonable” is not good enough.As a data-driven buyers’ agency, InvestorKit Team decide to test this theory with data today.
We use the SA3-level tenure data in the 2011 Census and examine the 5-Y and 10-Y sales and rental price growth rates of each SA3. We sample 325 SA3s and use 2013 as the starting point due to data availability.
National Trends
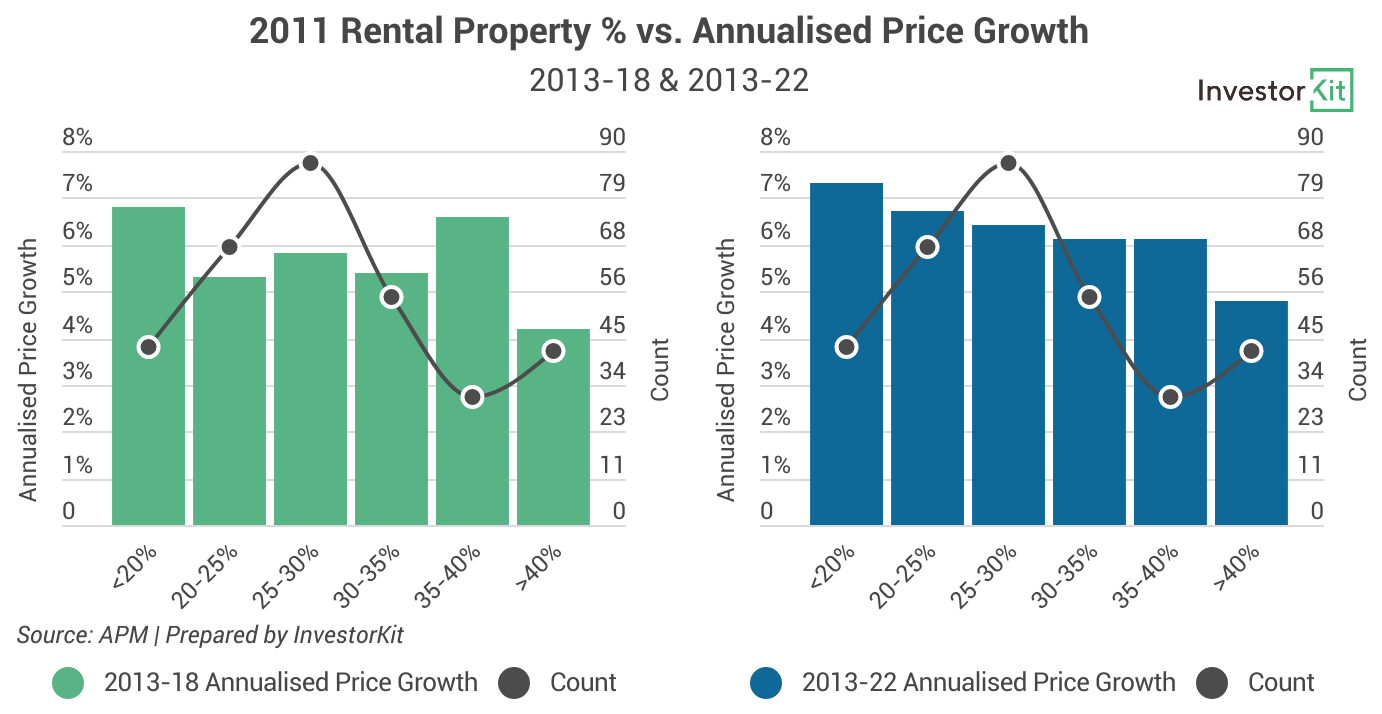
In the 2011 Census, Australian SA3s enjoyed a wide range of rental property percentages from less than 10% to close to 100%. If grouping them up, like in the below chart, you’ll see that most (70%) regions are within the range of 20%-35%, and the national average rental property percentage is around 30%.
In the chart, the dark-grey dots show the number of SA3s in each renter percentage group and the columns show each group’s average price growth rates in 2013-2018 (green) and 2013-2022 (blue).

In the shorter term (2013-2018), there are two peaks at <20% and 35-40%. It is important to note that the best performing regions in this group of 35-40% rental property % areas, are all in metro Sydney and Melbourne, the two cities that were having a major boom in the early 2010s. The metro area of Sydney and Melbourne enjoy higher renter percentages, so when they are in the fast-growing phase, the average performance of higher renter % regions would be pushed up. Especially as these %’s are based on units dominating these areas, however, the price growth of houses (our main focus of data) still continues as supply for houses is scarce there.
When more time is added into the mix, the trend would become clearer. In the longer term (2013-22), it is obvious that the fewer rental properties, the better growth.
It’s also not hard to note that the >40% group performs the worst in both scenarios. It could be an alert for investors who are thinking to invest in higher rental property % regions.
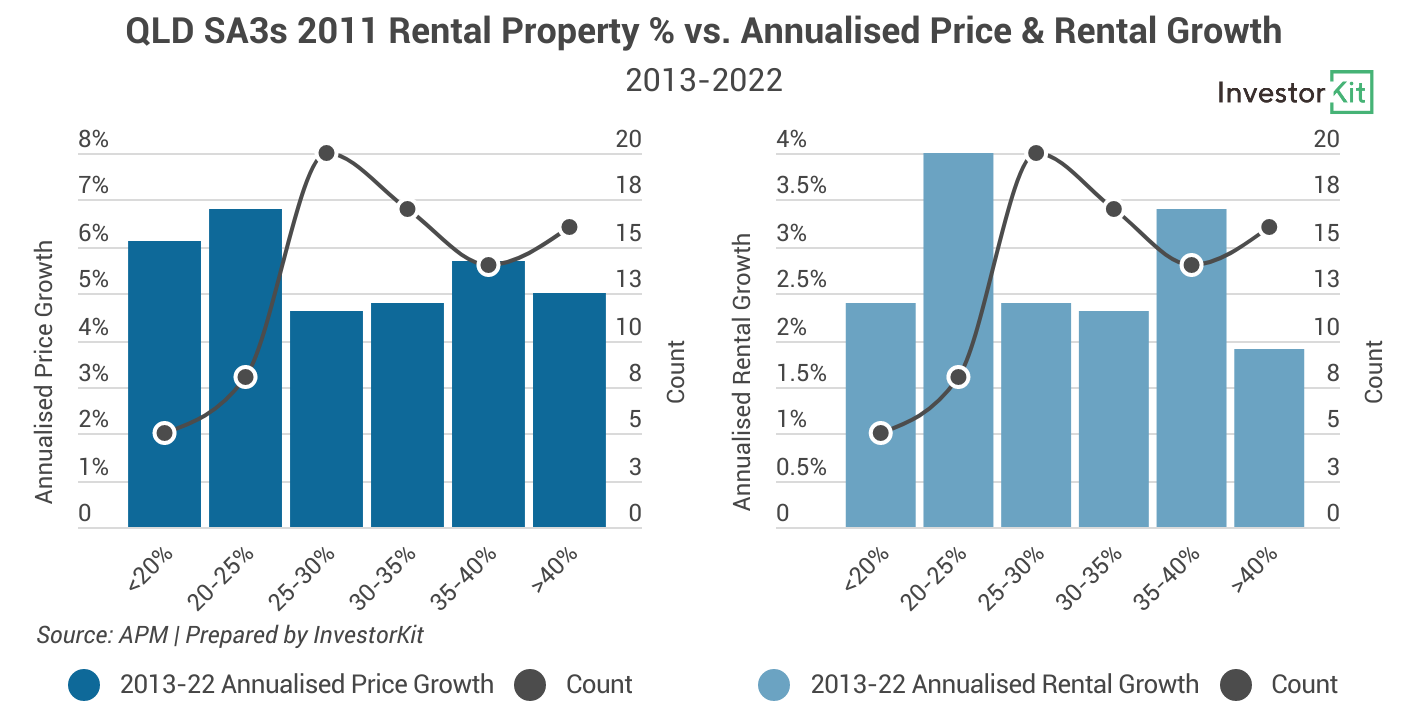
Next let’s have a look at the rental market (the below charts).

Trends aren’t as exactly like the sales market with clear step-downs in performance as brackets shift. However, they do both share similarities with low performance in the investor dominated pockets.
In the shorter term (green columns), rental price growth peaks at 35-40%. Interestingly, the best performing regions in this group are not those mentioned above for price growth. Three Gold Coast regions– Coolangatta (6.7% pa), Broadbeach – Burleigh (5.7% pa), and Robina (4.6% pa)championed here, demonstrating that the popularity of lifestyle cities.
And in the longer term, growth rates of lower renter % regions catch up and overtake the higher renter % regions.
Why the Trends?
– According to CoreLogic reports, owner-occupiers show a slightly longer hold period (9.2 years) than investors (8.9 years). This could result in a smaller number of house-for-sale in a certain period, and lower supply tends to lead to faster price growth.
– Similar in the rental market, lower rental property percentage means that a region has fewer properties for lease at anyone given time, and the tighter market could lead to faster rental growth.
In addition to the above, a widely acknowledged interpretation would be that owner occupiers tend to add more value to their properties than investors. Owner occupiers tend to do more renovations for a more comfortable living experience, while investors tend to minimise holding costs. Therefore, when reselling, the value added by the owner-occupier could make their house grow more in value than an investment house.
Other anecdotal reasons include that owner occupiers may take better care of their house than tenants; more investors tend to sell when the market is down, further increasing supply in rental-property-concentrated areas; etc.
However, there are exceptions.
While the trend is clear on the national level, it’s not significant on the lower levels. When we look at each state separately, you’ll find exceptions.
– Areas surrounding CBDs
Taking NSW as an example, while the state largely demonstrates the national trend, the >40% group’s exceptionally high price growth is eye-catching.

This group contains 7 regions (shown in the below map):
· Sydney Inner City
· North Sydney – Mosman
· Eastern Suburbs – South
· Eastern Suburbs – North
· Marrickville – Sydenham -Petersham
· Parramatta

These regions are concentrated to the 3CBDs of Sydney – Sydney City, North Sydney, and Parramatta. Their rental property percentages are dragged up by the huge number of high-rise apartment buildings, which are sought after by young adults and international students. In the meantime, the house (freestanding house) markets here enjoy extremely low new supply levels as there is hardly any available lands for free standing houses. The below chart shows how low their freestanding house building approval levels are compared to Greater Sydney over the last decade. Desirability combined with low house supply have pushed prices up here, even though the suburb is very popular with renters.

Similar cases can be found around Melbourne City and other major CBDs across the country.
– Lifestyle cities
In Queensland’s case, we see two peaks in both sales and rental markets – 20-25% and 35-40%, while the rest groups’ growth rates generally decline as renter percentage rises.

What made these two groups special?

If we map the two groups and their growth rates (above figures), it’s easy to tell that the high growth rates are mostly contributed by the regions in the Gold Coast and the Sunshine Coast. High housing demand has been playing a much more important role in their price growth than renter percentage.

This can be seen in other lifestyle regions, such as the Byron Bay region or Shoalhaven region of NSW.
At a national level, data generally demonstrates the trend that the lower renter percentage, the higher growth for price. Regarding rental price growth at a national level, data demonstrates that areas with high rental property %’s tend to underperform.
Micro trends display that this assumption does not clearly apply to every region. Property markets are influenced by a huge number of factors, and the rental property percentage should never be your sole reference making any decision. Individual factors like rental %’s can simply be used as a further check to enhance risk management when buying.
Compared to the rental property percentage, the local economy, housing demand/supply and market pressure are more vital for property growth. Some useful indicators include internal migration trend, population growth, unemployment rate, building approvals, inventory levels, rental vacancy rates, local economies and more.
The InvestorKit Research Team examine all sorts of economic and market data every day to make sure that our clients can access markets with substantial capital growth potential. If you are looking to buy your investment properties based on data but don’t have time to do it yourself. Click here and request your 45-min FREE no-obligation consultation today!
.svg)
