“The crime rate seems high in this suburb; should I avoid it?”
That is one of the most frequent questions we receive from InvestorKit clients.
Crime rate is a big concern for many property investors. Intuitively, a higher crime rate means lower demand in both the sales and rental markets, leading to lower capital growth and rental growth.
However, is that the truth, or nothing but a delusion? Let’s find that out with data today.
With the total number of crimes in every NSW suburb over the past 10 years (Data.NSW) and their population data (Census), now we’re about to test the correlation between crime rate (# of crimes/population) and house price growth, rental price growth over 1 year, 5 years, and 10 years.
There is no necessary correlation between crime rate and sales or rental growth.
In testing the correlation between the crime rate and house price growth, we regress 1057 suburbs (that have valid house price data)’ house price growth rates over 2014-15, 2014-19, and 2014-24 on their 2014 crime rates. Below are the results.
- Crime Rate vs. 1Y Price Growth: No statistically significant correlation
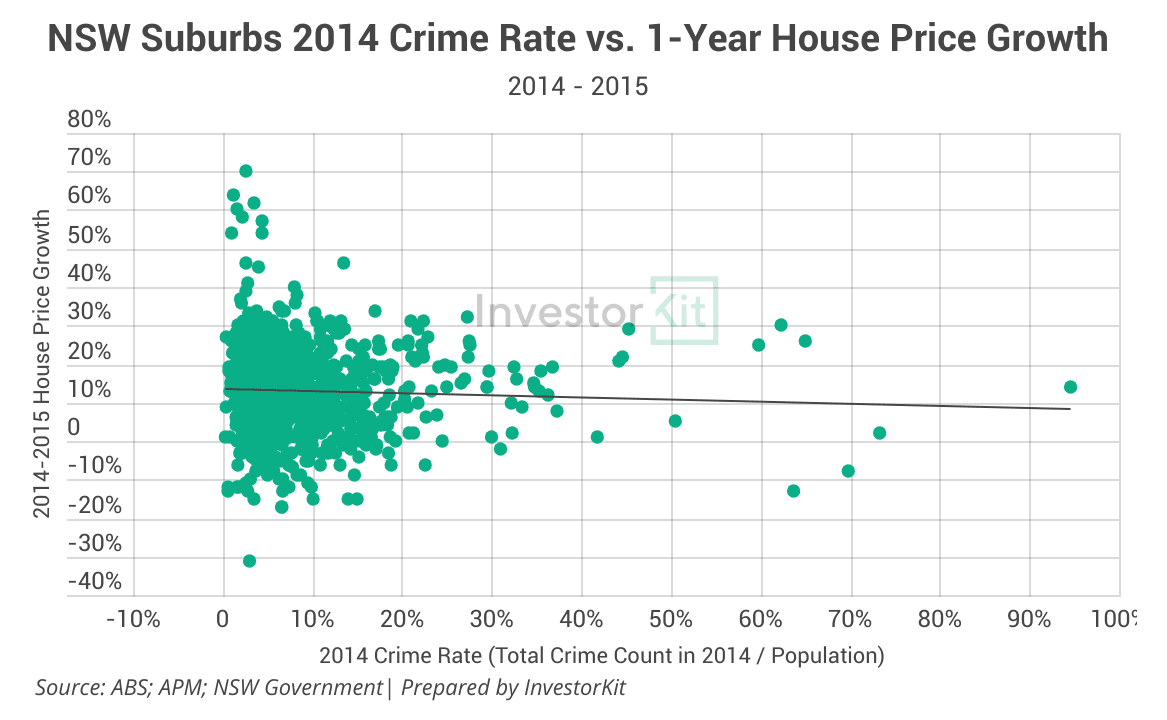
In this model, we get a correlation coefficient of -0.05, meaning that a 1% increase in crime rate would, on average, lead to a 0.05% decrease in 1Y house price growth – That seems negligible to me.
Moreover, this correlation is not statistically significant; in other words, there’s no sufficient evidence to reject the hypothesis that “there’s no correlation between the 2014 crime rate and the 2014-15 price growth”. Below is how we find out –
To determine if a regression model is statistically significant, we conduct a t-test and check its p-value (p stands for “probability”). The model / correlation is only statistically significant when the p-value is smaller than 0.05. And here for this model, our p-value is 0.166, larger than 0.05.
- Crime Rate vs. 5Y Price Growth: No statistically significant correlation
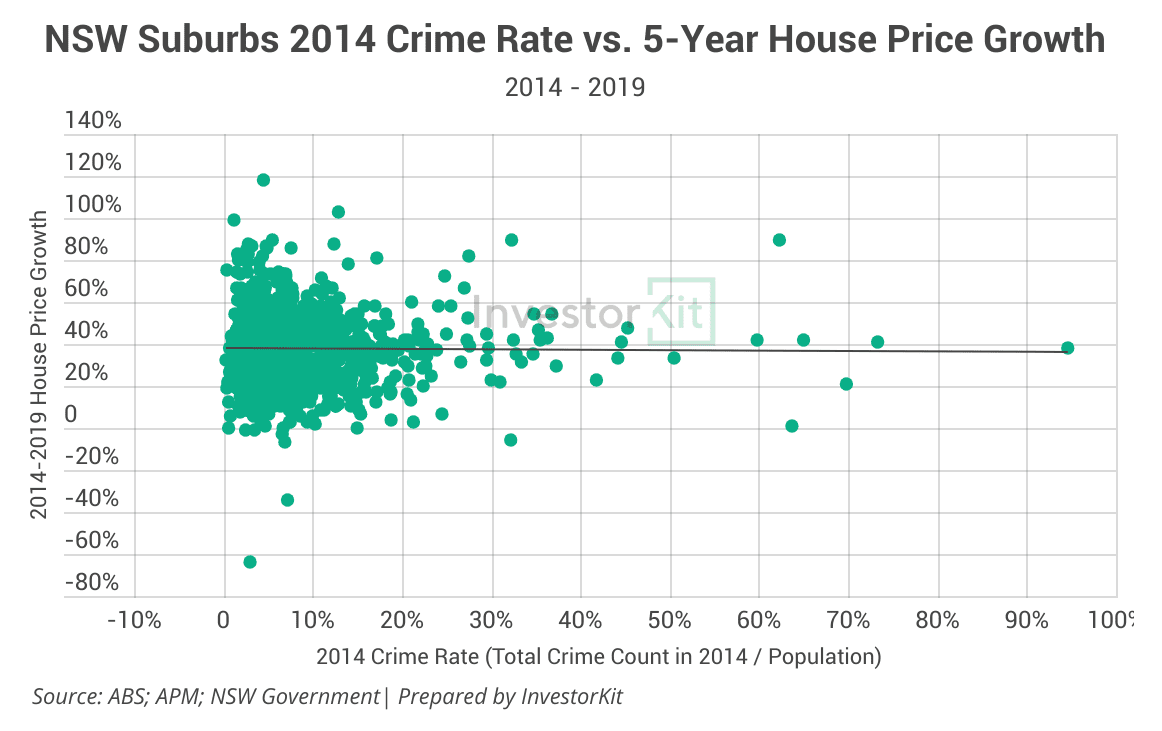
In this model, we get a correlation coefficient of -0.03, meaning that a 1% increase in crime rate would, on average, lead to a 0.03% decrease in 5Y house price growth – Again, negligible.
What’s more, this correlation is not statistically significant, either. The p-value in this t-test is 0.539, even higher than that in the 1Y model.
Then, how about 10y growth?
- Crime rate vs. 10Y Price Growth: Weak negative correlation
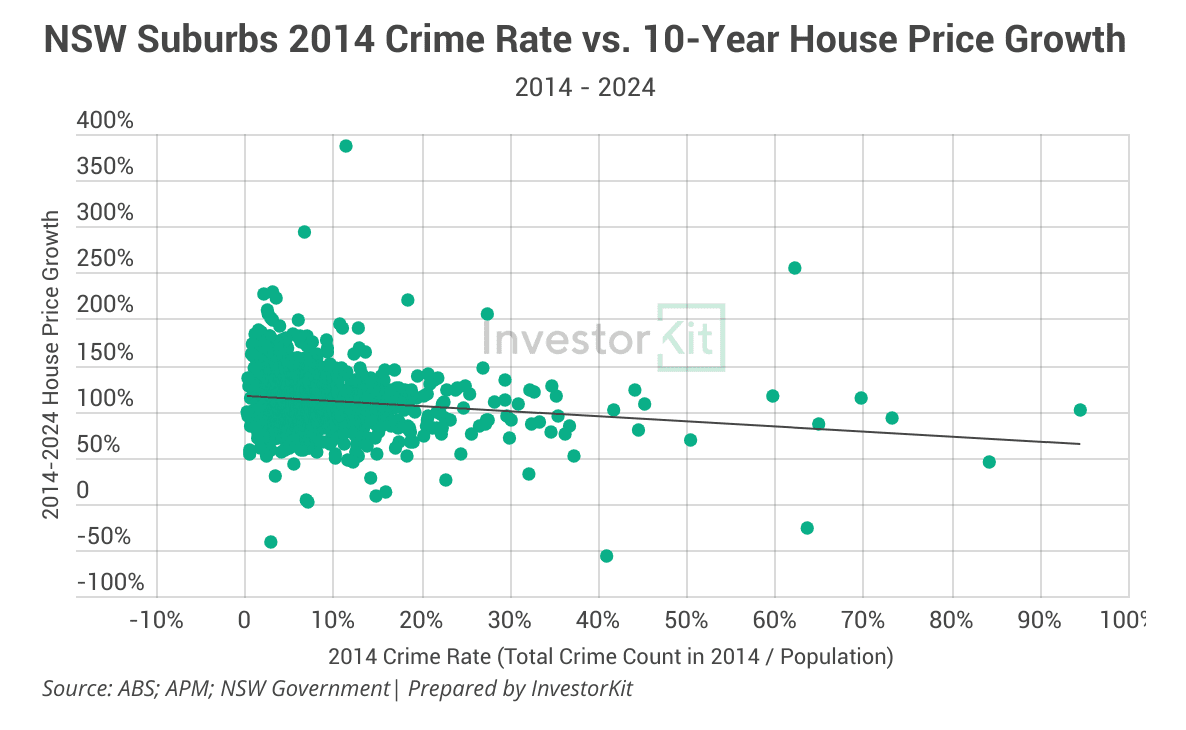
In this model, we finally got a statistically significant correlation with a p-value of 0.00038.
However, the coefficient? -0.43, meaning that every 1% increase in crime rate would, on average, result in a 0.43% decrease in 10y total value growth, approximately 0.04% per year. That, again, seems too low to be a concern.
Similarly, let’s analyse the correlation between the crime rate and house rental price growth. This time, 396 suburbs have valid house rental price data.
- Crime Rate vs. 1Y Price Growth: No statistically significant correlation
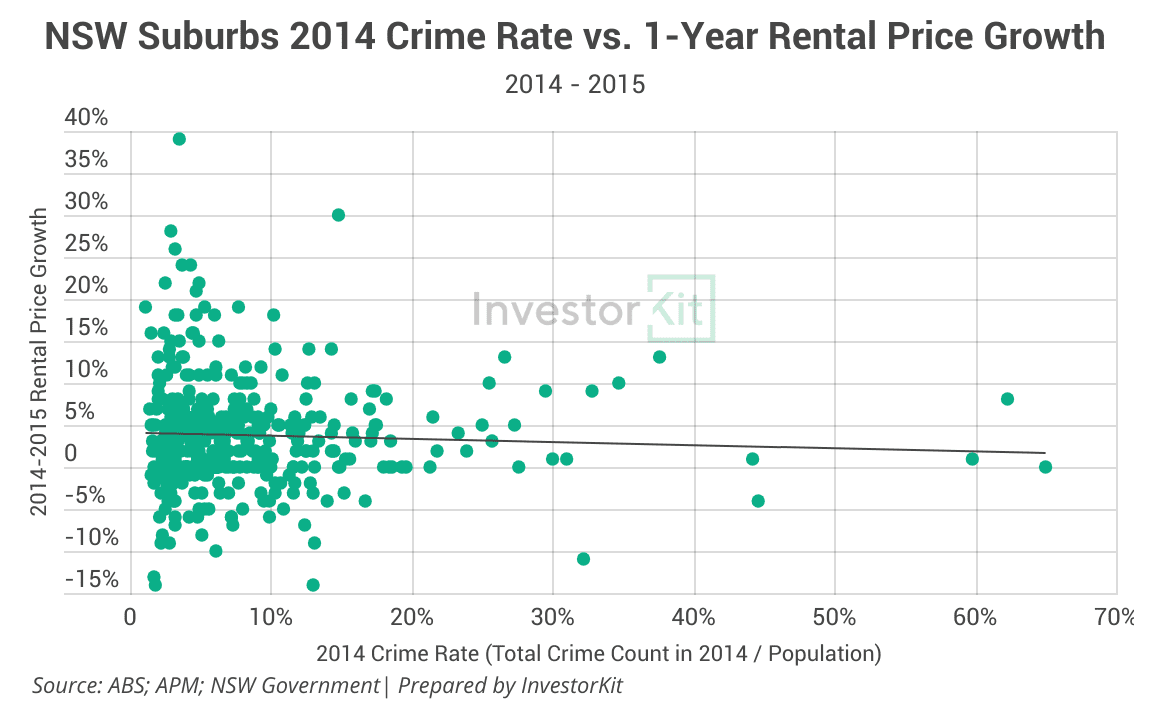
In this model, we get a large p-value again (0.331), indicating no statistically significant correlation between the 2014 crime rate and the house rental growth the following year.
Even if the correlation was significant, our correlation coefficient here is -0.04, another negligible one.
The 5y correlation may surprise you –
- Crime Rate vs. 5Y Price Growth: Positive correlation
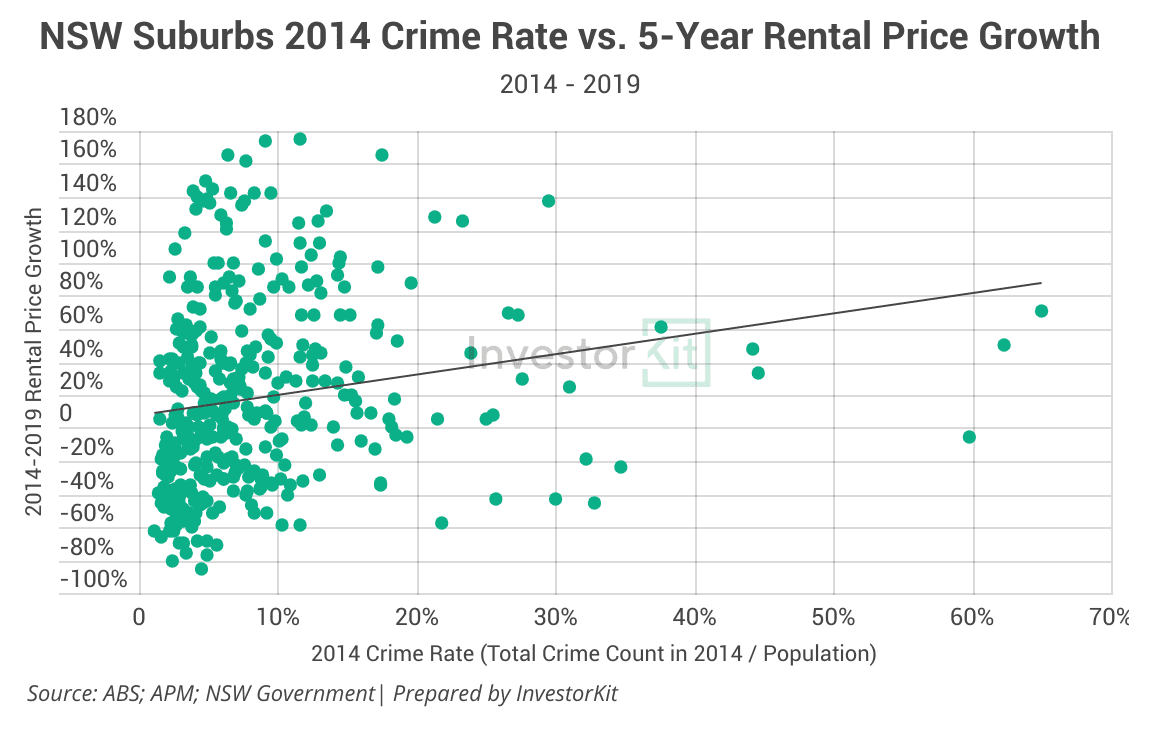
In this model, we get a p-value of 0.012, smaller than 0.05, so the correlation is significant. However, surprisingly, the correlation coefficient is 1.16, meaning that every 1% increase in crime rate would, on average, lead to a 1.16% increase in the total rental growth in the 5 years from 2014 to 2019!
How about in the longer term?
- Crime Rate vs. 2014-2024 Price Growth: No statistically significant correlation
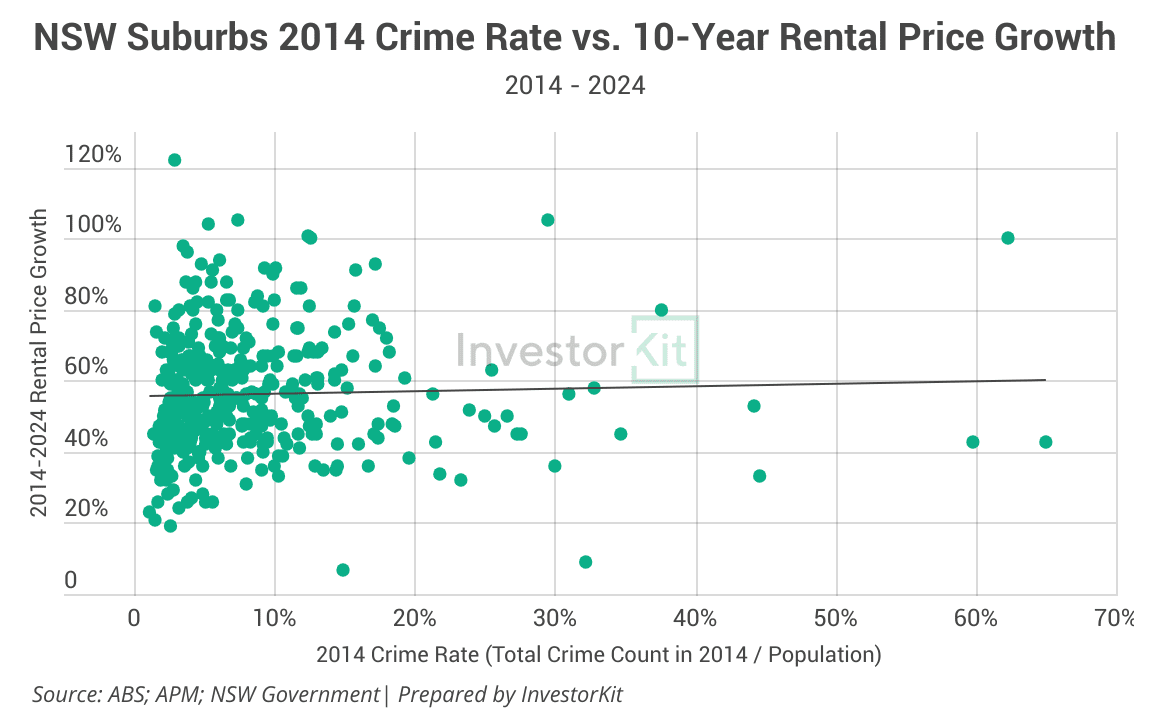
In this model, the t-test p-value becomes large again (0.499), indicating no statistically significant correlation between the 2014 crime rate and the total house rental growth in the 10 years to 2024.
And if you’re curious about the correlation coefficient, it also becomes negligible: just 0.07 (interestingly, it’s still positive).
After checking all six regression models, we can confidently conclude that the crime rate doesn’t necessarily correlate with price growth or rental growth.

- It negatively correlates with the last 10-year house price growth, but the coefficient was negligible;
- It even positively correlates with the 5-year rental growth from 2014 to 2019, the opposite of what we would assume intuitively. This could result from gentrification, but it’s worth a deeper dive in future studies.
For investors, it’s also essential to remember that statistical trends are not rules. Not all suburbs align with macro trends. Let’s take the 10-year house price growth as an example. In 2014, Burwood, an Inner-West Sydney suburb’s crime rate was 21% (21 crimes per 100 people), while Kogarah Bay, in southern Sydney, saw only 2% crime rate – Which suburb do you reckon has grown better in the following 10 years (2014-2024)?
- Burwood has grown by 130%
- Kogarah Bay has grown by 94%
Crime Rate May Affect Your Cashflow
While the crime rate doesn’t affect growth, it could affect your cashflow.
On the one hand, if your property is in a suburb with a higher crime rate and you choose tenants randomly, the probability of getting a tenant with a bad rental history could be higher. That could lead to rental repayment arrears. However, there is an easy fix; we will discuss it in the next section.
On the other hand, your property faces a higher risk of being damaged/broken in, leading to potentially higher maintenance costs and higher home insurance premiums.
Insurance companies calculate building and landlord insurance premiums based on many factors, including the local crime rate. The below table shows some of the major factors insurance companies consider when they calculate your insurance premium:
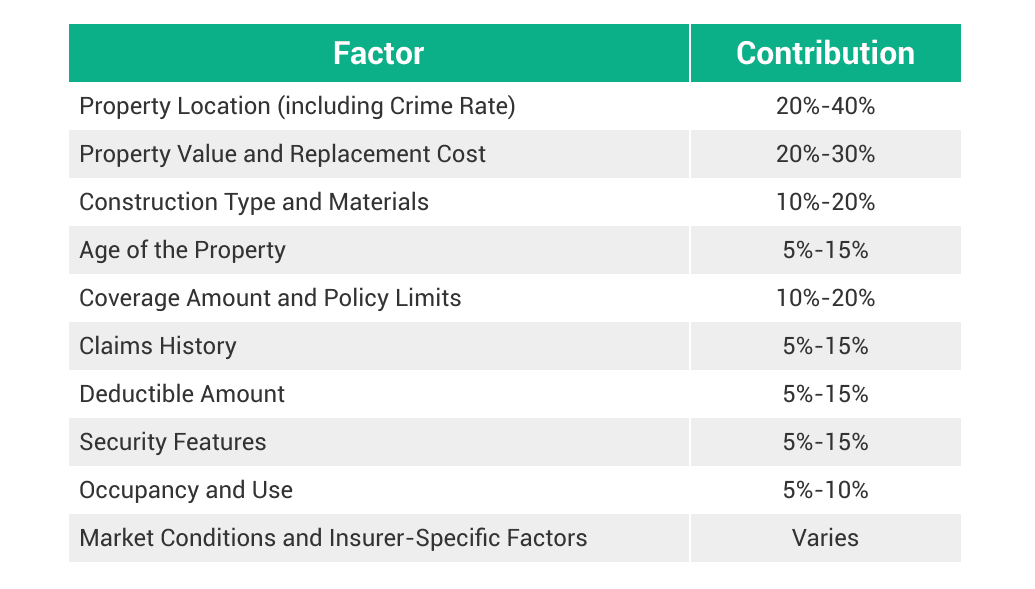
“Property Location” includes crime rate, proximity to fire services, flood zones, general neighbourhood risk, etc. In neighbourhoods with particularly high crime rates, crime could be a significant contributor to the location risk, potentially making up 40% to 50% of the location factor’s impact on the premium – Let’s say, in the worst scenario, crime rate could make up to 20% difference in your insurance premium.
Say your home insurance premium is $160 per month, which is the average of the biggest states including NSW, VIC, QLD, and WA; an extremely high crime rate could cost you a maximum extra $32 per month – That’s a small amount compared to your total rental income, and more importantly, you have many other location options than those with extremely high crime rates.
How to Minimise Your Cashflow Risks
Assuming your property is in a relatively high crime rate area, how can you minimise your risk?
We consider it from two aspects – internal and external.
Internally, it’s essential to have a reliable tenant. Even in a suburb with a relatively high crime rate, most residents are just average good folks, not criminals. With support from a good property manager, you can easily select a tenant who has(ve) a good rental history, has a stable job(s), and can afford the rental price. That would minimise your risk of rental arrears and property damage by your tenants.
To reduce external risks, strategies such as installing security systems can enhance physical security, protect your property from theft or other damage and lower your insurance premium.
Crime Rate Can Change Overtime
Crime rates don’t remain the same all the time. One powerful driver of change is gentrification. Here are two examples: Sydenham (Sydney) and Byron.
Sydenham
- In 2014, the crime rate was 95%, when the median household weekly income was $1,423. The top 3 resident occupations were professionals (22%), Clerical and Administrative Workers (16%), and Technicians and Trades Workers (13%).
- In 2024, the median household weekly income is $2245, 58% more than 10 years ago, a much higher increase than Greater Sydney’s average growth of 44%. Now, the top 3 resident occupations are Professionals (31%), Managers (16%), and Technicians and Trades Workers (11%). And the crime rate has come down to 59% (still high, admittedly).
Byron Bay
- In 2014, the crime rate was 62%, when the median household weekly income was $871.
- In 2024, the median household weekly income is $1,561, 79% more than 10 years ago, a much higher increase than regional NSW’s average growth of 49%. Now, the crime rate has come down to only 22%.
Data has proven that the crime rate is not necessarily correlated with your investment property’s capital or rental growth. If there is any impact, it affects slightly your cashflow by increasing insurance premiums and posing a higher risk of rental payment arrears. However, these impacts, especially rental payment arrears, can be avoided or minimised with simple strategies. Furthermore, the crime rate isn’t unchangeable. As an area gentrifies or a community becomes more well-developed, crime rates would fall, and the risks associated with high crime rates would decrease, too.
If crime rates do not matter to investment property’s growth, then what matters? InvestorKit buyers agency spends hundreds of thousands of dollars each year on data and research to monitor the key factors that have real impacts on the property market’s growth and help our clients grow their wealth the most efficiently — Interested in the key factors and how InvestorKit analyse them? Talk to us today by clicking here and requesting your 15-min FREE no-obligation discovery call!
.svg)
