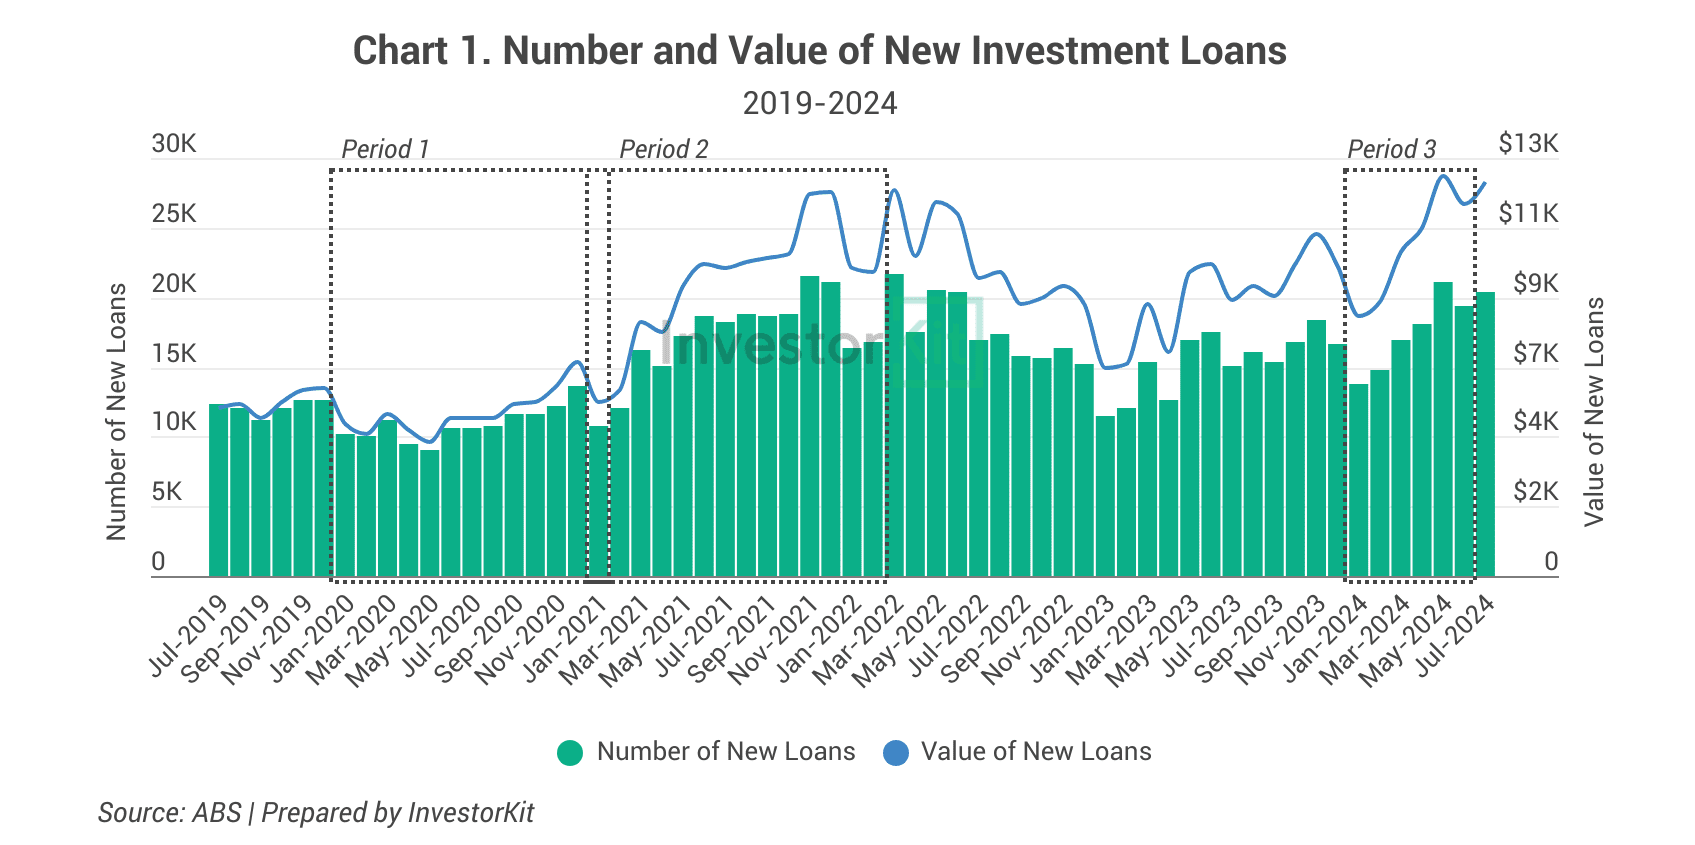
The latest Australian Bureau of Statistics (ABS) data reveals a substantial rise in investor lending activity, with the value of new loans hitting its highest levels since 2021 (see Chart 1). This upswing in lending activity signals a resurgence in investors’ confidence. In the meantime, it raises concerns that this could be an early sign of another wave of housing price surges.
Many people believe that investors are the villains driving house prices through the roof. But hold on — Are investors to be blamed?
In this blog, we’ll uncover the bigger picture behind the housing booms.
Investors, in isolation, are not the cause of property booms.
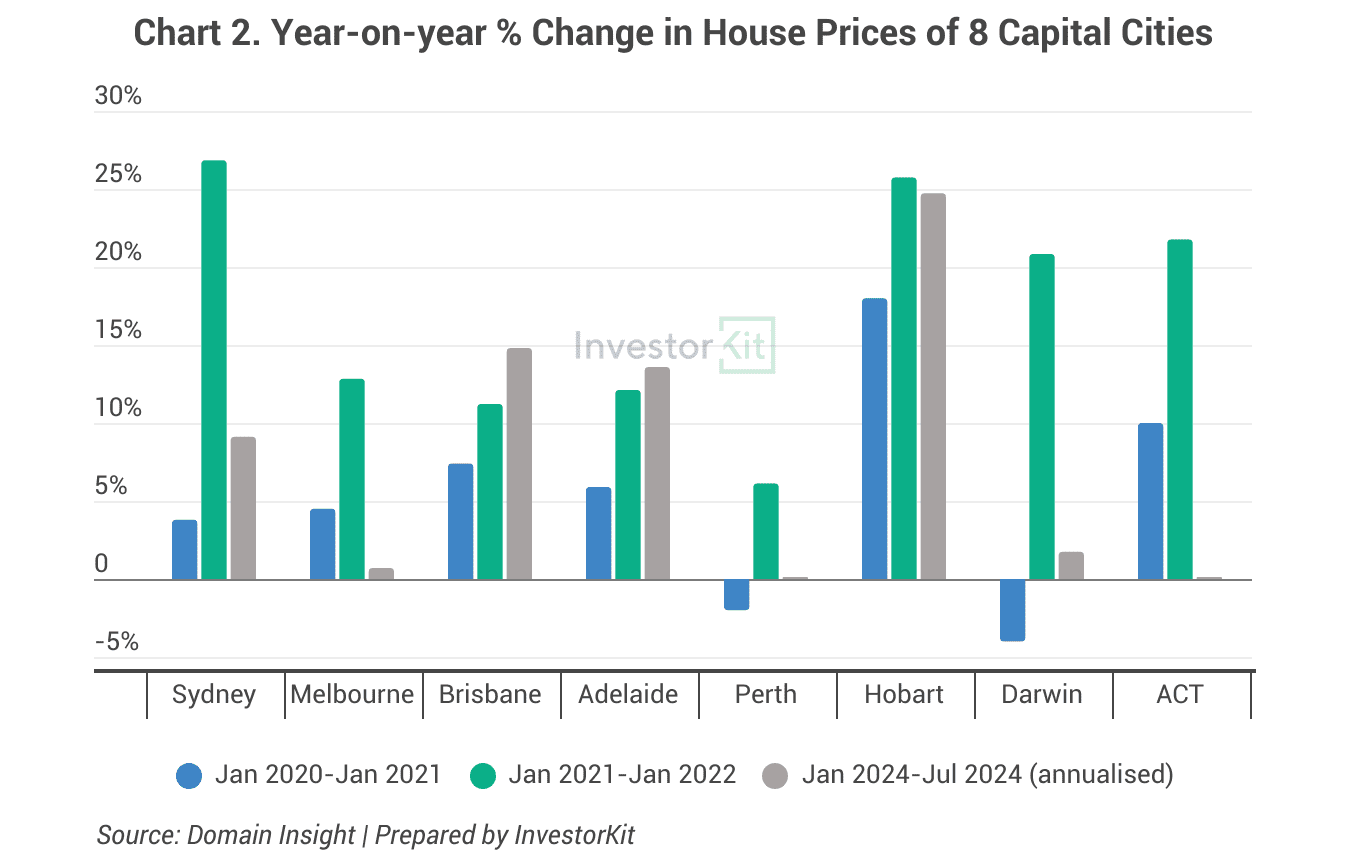
To see whether investors have a considerable influence on house prices, Chart 2 below reveals the one-year price changes of eight capital cities in three periods (marked in Chart 1).
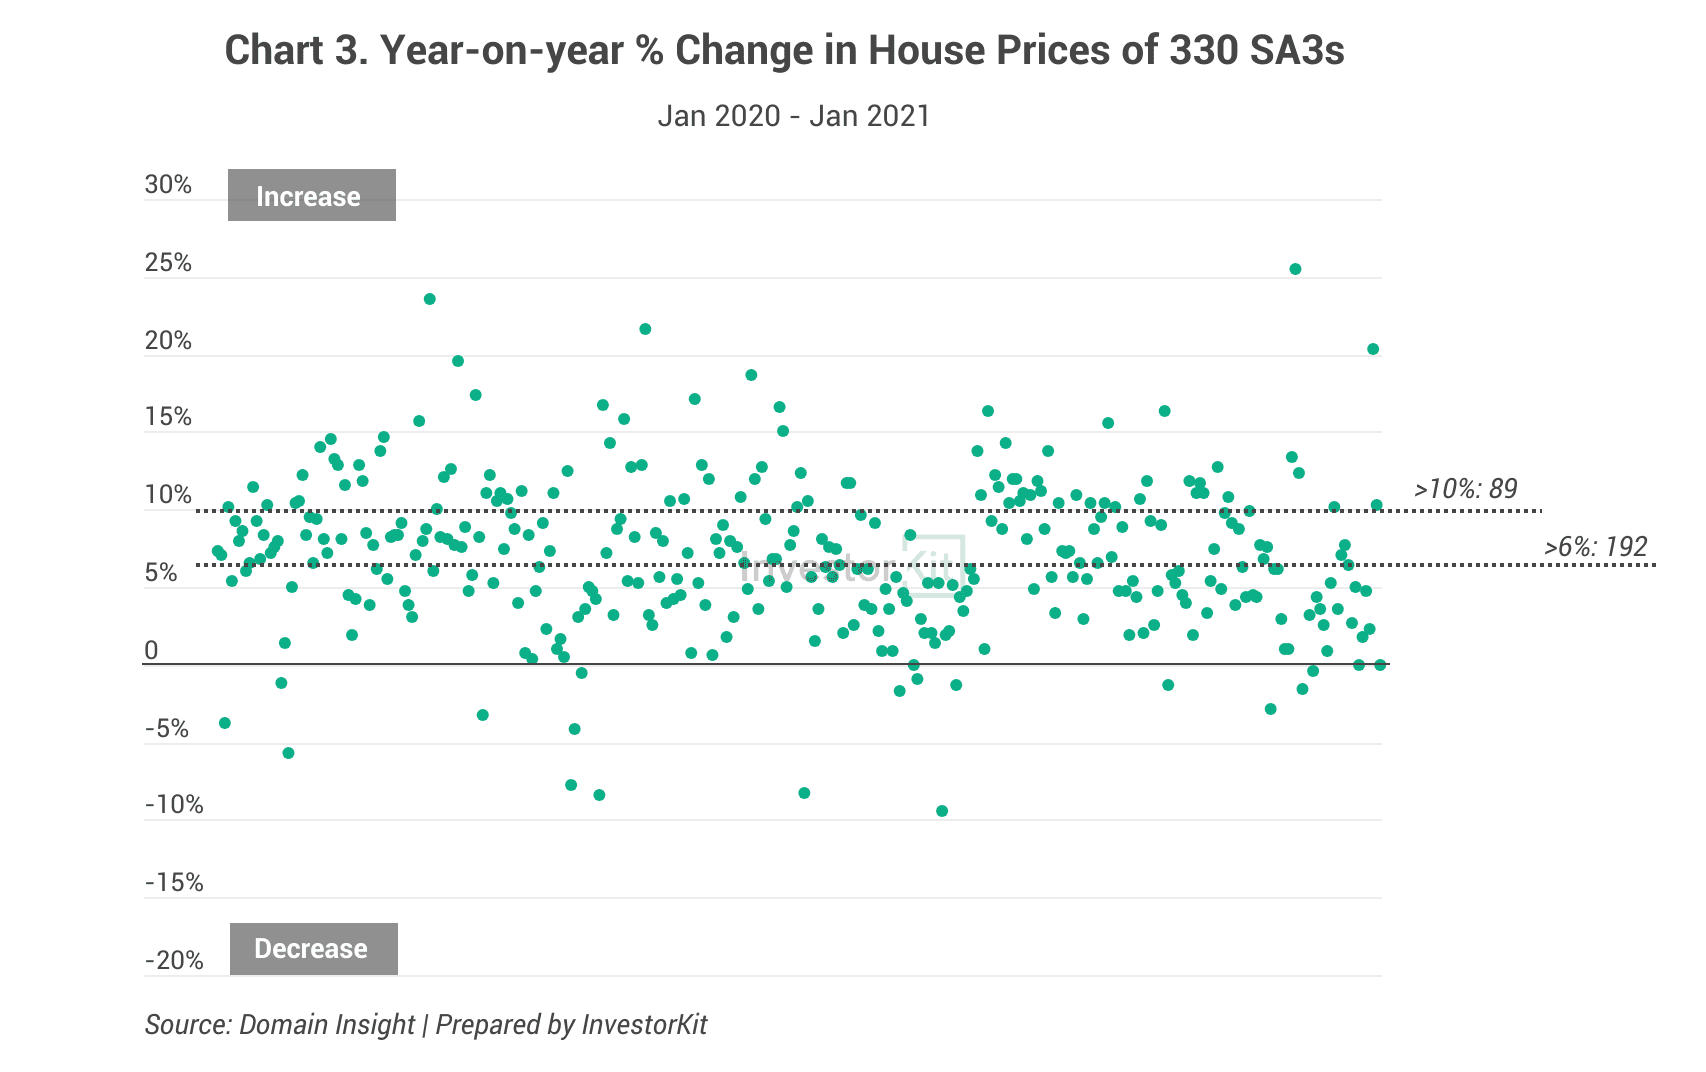
- Period 1 – Jan 2020 to Jan 2021: Investor lending activity was low. Sydney, Melbourne, Perth, and Darwin didn’t perform well in the house market, but Hobart and Canberra achieved double-digit growth (see Chart 2). At the SA3 level, 192 out of 330 (58%) SA3 regions recorded above-average (>6%) house price growth, and 89 (27%) of them achieved double-digit growth (see Chart 3).
- Period 2 – Jan 2021 to Jan 2022: Investor lending activity was increasing. Prices surged in all the capital cities except Perth, which only saw 6% annual growth.
- Period 3 – Jan 2024 to Jul 2024: Investor lending activity bounced from the bottom and rose to the same level as in late 2021. If we annualise each city’s growth based on their performance over the past half a year, Brisbane, Adelaide and Perth are the only “booming” capital cities. Sydney is growing well, but much slower than 2 years ago. You may argue that investors might have targeted the three booming cities, but remember, they have been the top performers since 2022, not just after investors’ activity recovered.
No matter how active or inactive investors are, there are always great and poor performers. Countless factors influence the property markets, and the activity of investors is just one of them.
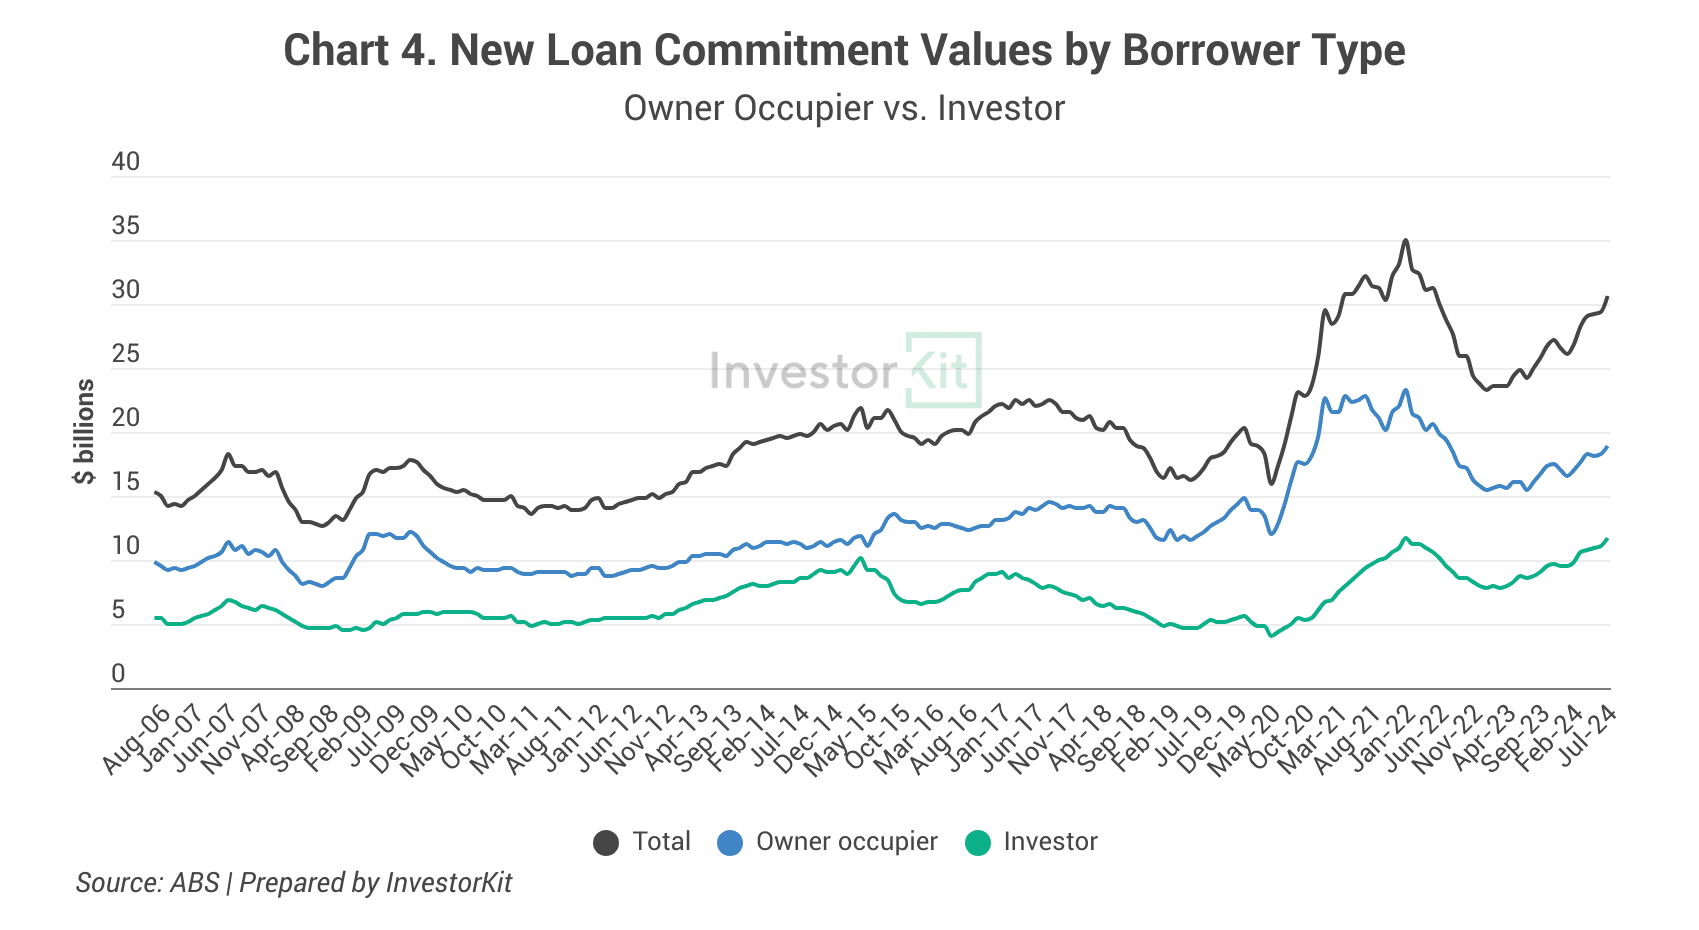
Moreover, the owner-occupiers’ lending activity has always been moving together with the investors’ (see Chart 4). How can you tell whose contribution to market demand is more significant?
What drives house price booms?
Let’s take the COVID housing boom from mid-2020 to mid-2022 as an example. In that period, low interest rates, shifts in buyers’ preferences, and limited housing supply were some of the most critical drivers of price surges.
Low Interest Rates
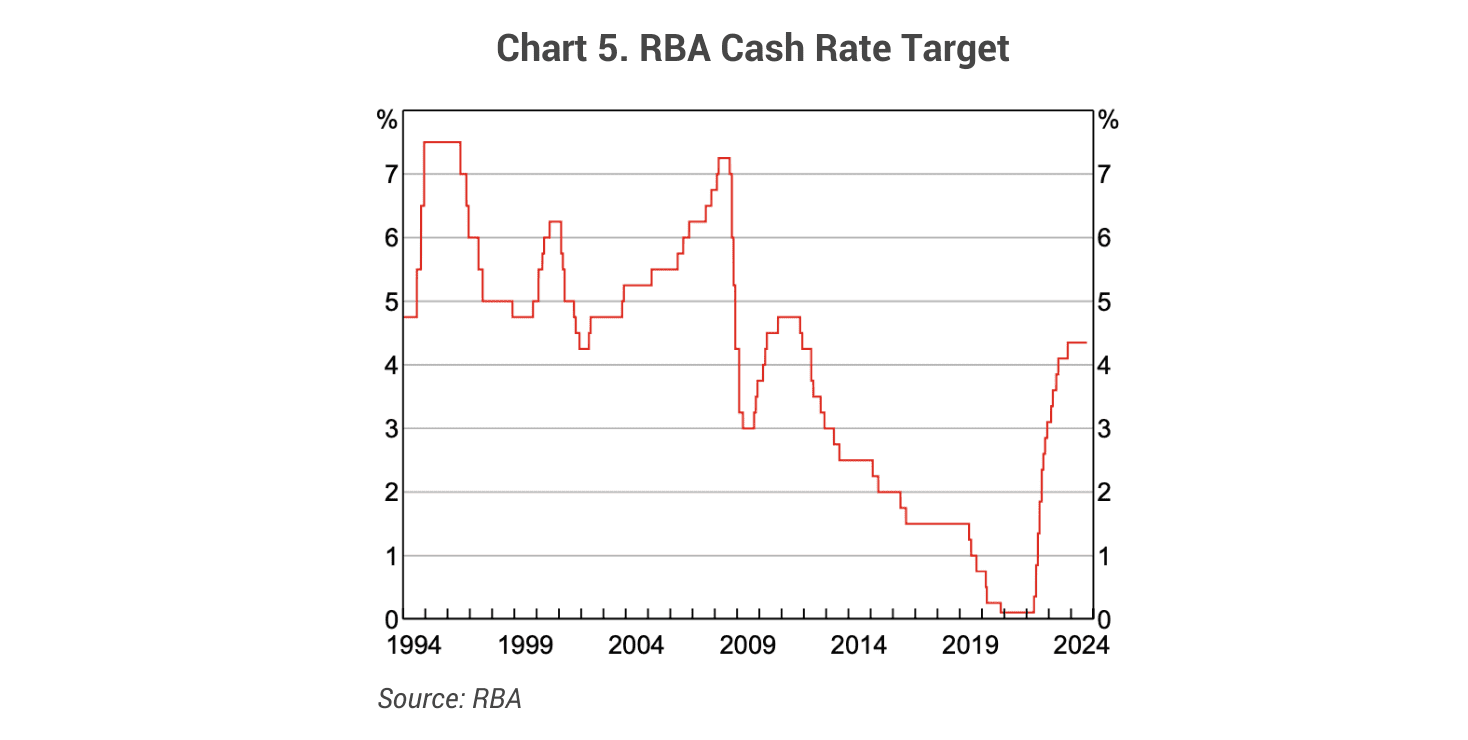
In response to the economic impacts of the COVID-19 pandemic, the Reserve Bank of Australia (RBA) lowered its cash rate target to a historically low level of 0.1% in 2020 and didn’t raise it until May 2022 (see Chart 5).
This action profoundly increased the real estate market demand. Investors, owner-occupiers and first-home buyers were all encouraged to enter the property market.
The chart below shows that the numbers of both owner-occupiers and investors were increasing from mid-2020 to early 2022 encouraged by the low interest rates (although the unfortunate result was that first-home buyers were gradually squeezed out of the market because of the high prices).
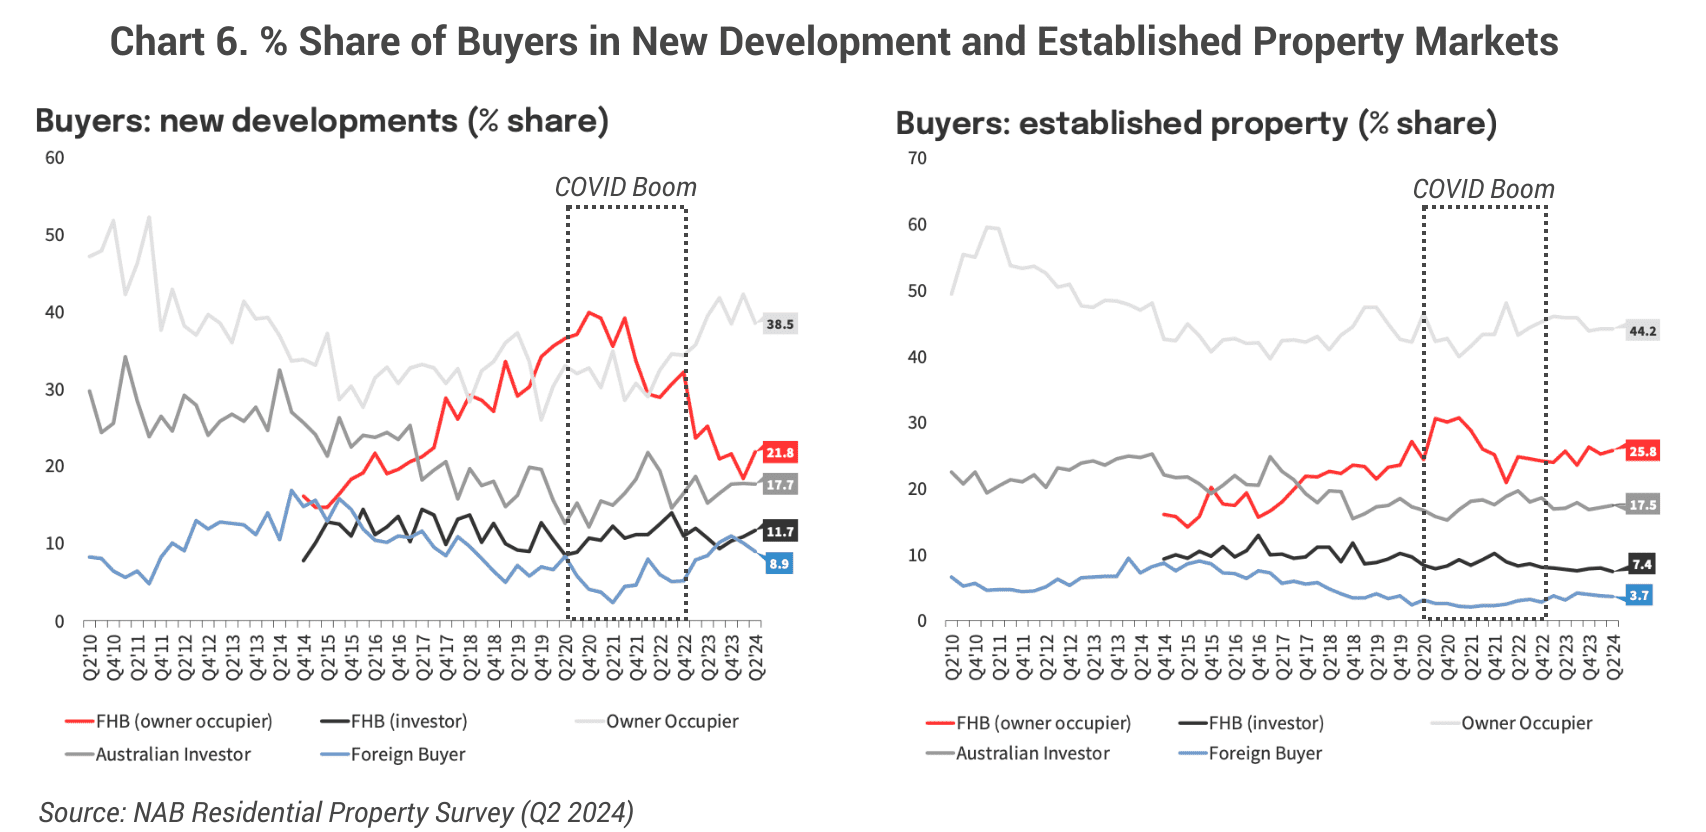
With more buyers encouraged to enter the property market, the competition for available stock became intense, eventually leading to a sharp rise in home prices between late 2020 and mid-2022 across the country, known as the COVID boom.
Buyer Preference Shifts
A notable shift in buyer preference is the second factor contributing to the COVID housing boom in the regions. More people moved to regional cities because of the flexibility in work arrangements, affordability, space, and natural access, resulting in a substantial jump in demand for properties in the regions.
Research by Rowley et al. in 2023 about Population Changes between 2019 and 2022 revealed significant changes in population dynamics, with low or negative growth within inner urban areas and positive growth in regional towns and cities, especially those associated with sea and tree changes.
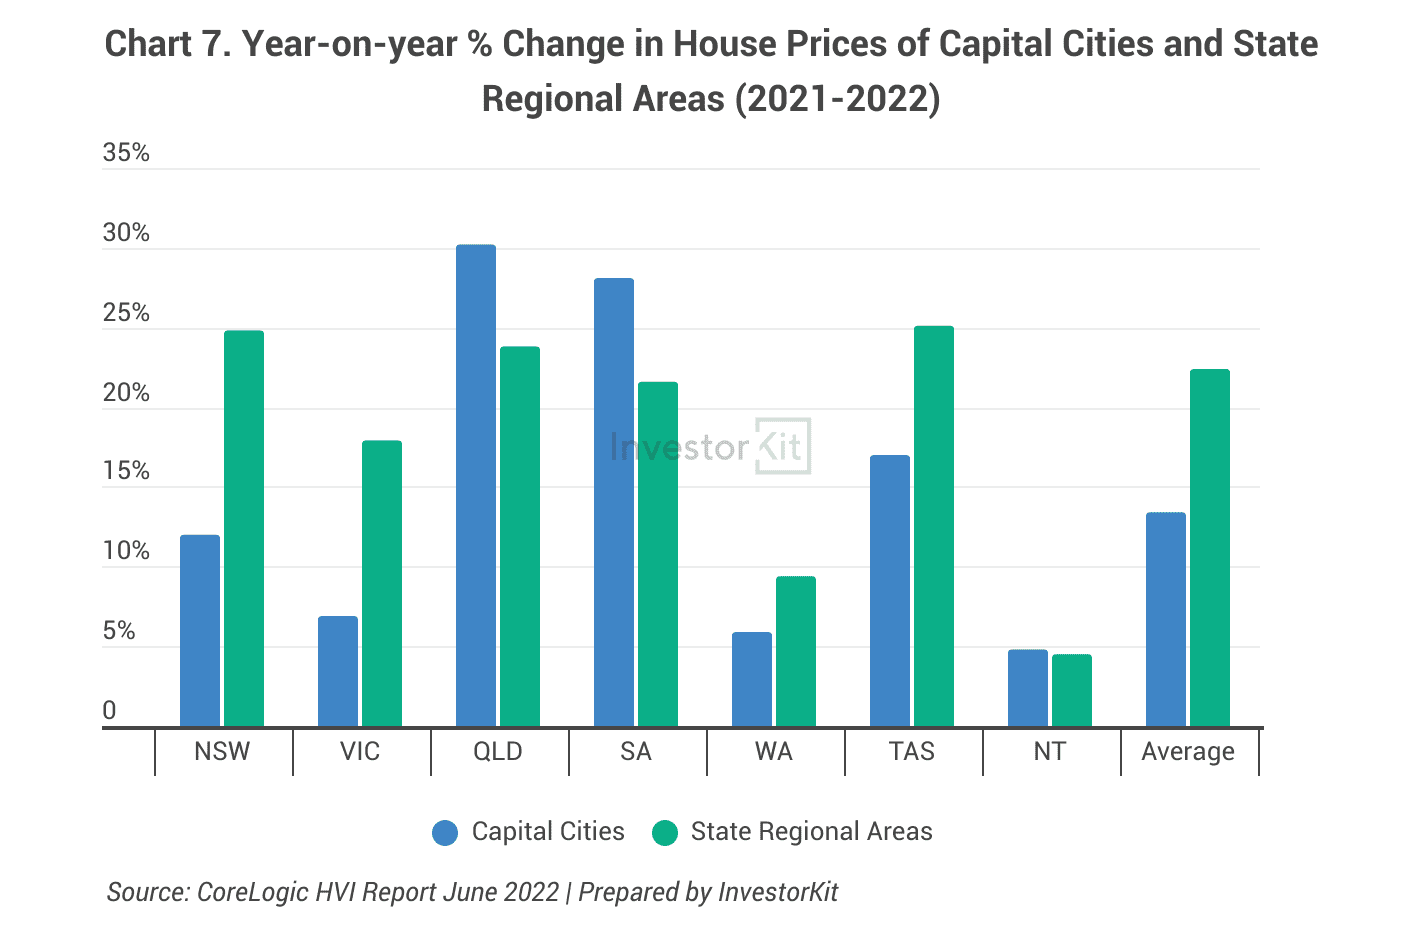
Eventually, the relocation trend led to robust dwelling price growth in regional areas. According to the CoreLogic June 2022 report, most state regional areas, excluding regional Western Australia and Northern Territory, experienced a rapid climb in house prices by at least 17% (see Chart 7), outweighing capital cities’ performance on average.
Housing Supply Constraints
From 2021 to mid-2022, many parts of Australia experienced a severe housing shortage driven by an unexpected surge in demand, less willing-to-sell owners, construction delays, and increasing building costs.
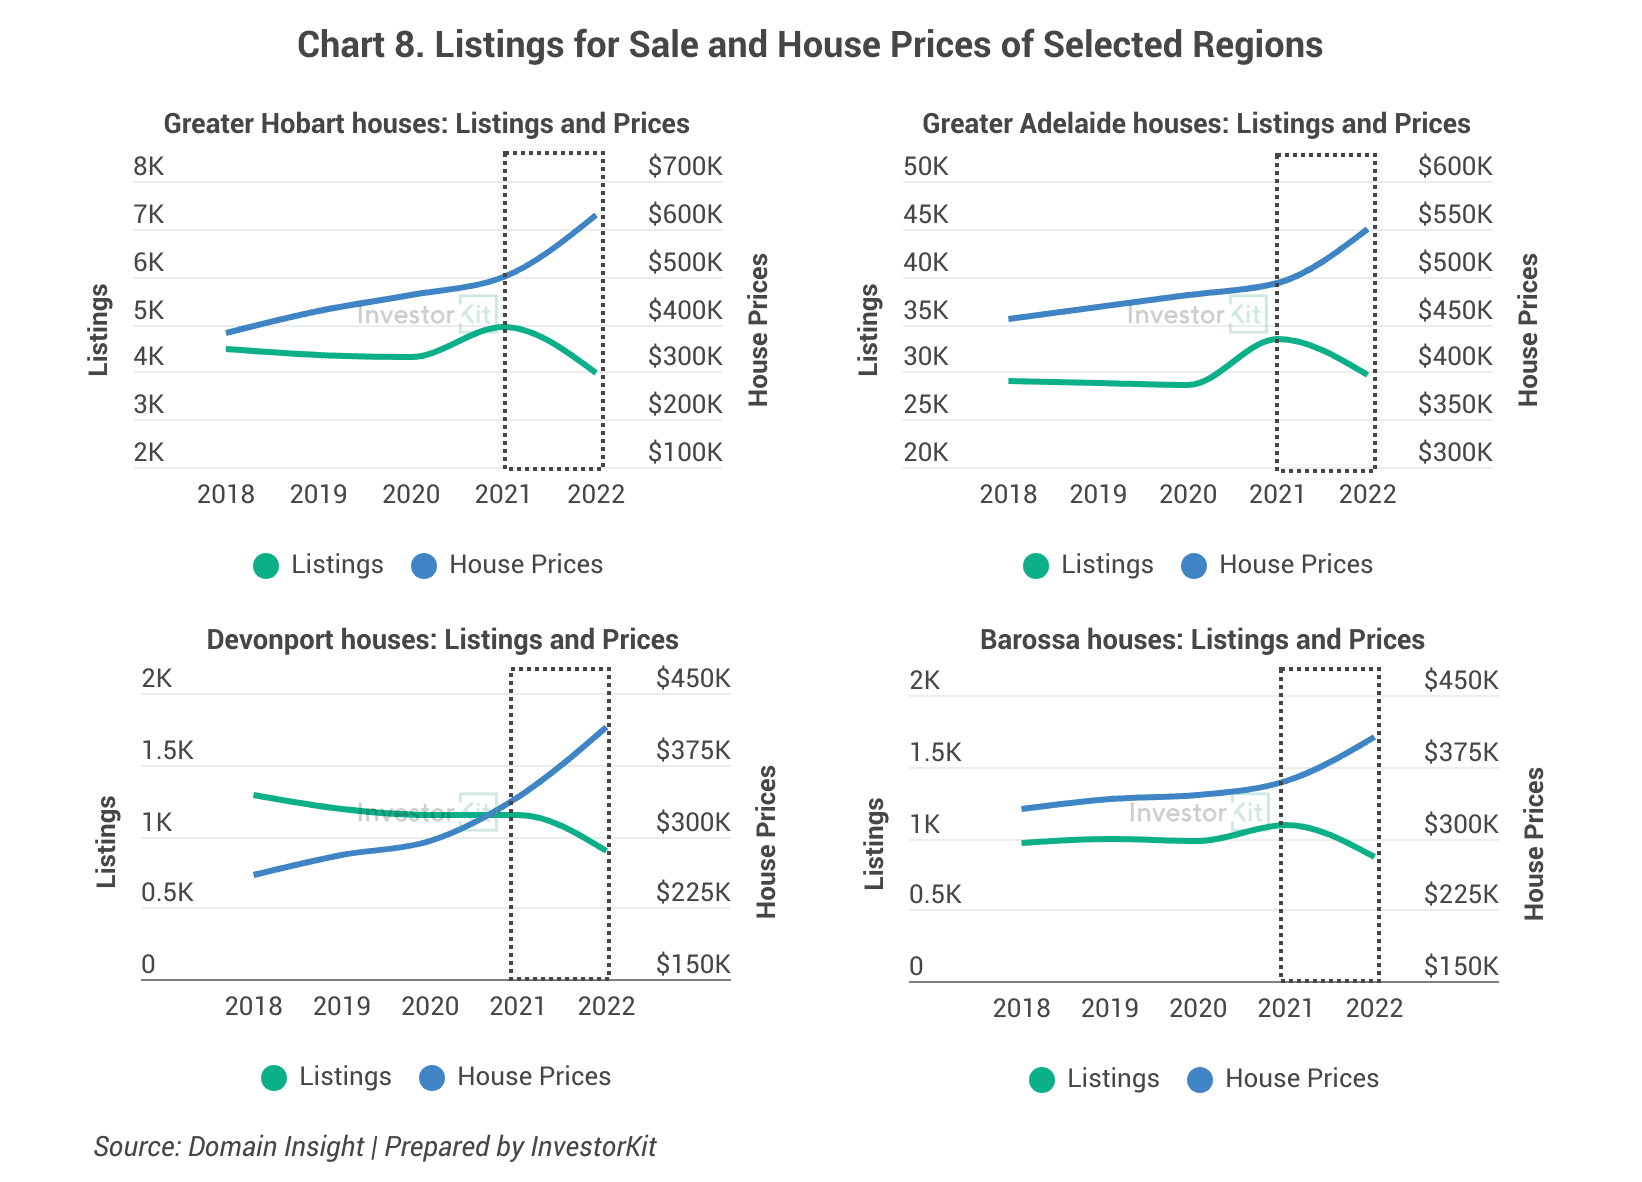
On the one hand, fewer existing homes were listed for sale. Chart 8 indicates a negative relationship between the number of listings and price growth of two capital cities (Hobart and Adelaide) and two regional SA3s (Devonport and Barossa) from 2018 to 2022. They all experienced a steep fall in house listings for sale and a considerable rise in house prices.
On the other hand, pandemic lockdowns, global supply chain disruptions, and labour shortages caused a surge in building costs. They slowed the construction of new homes, further exacerbating the supply shortage.
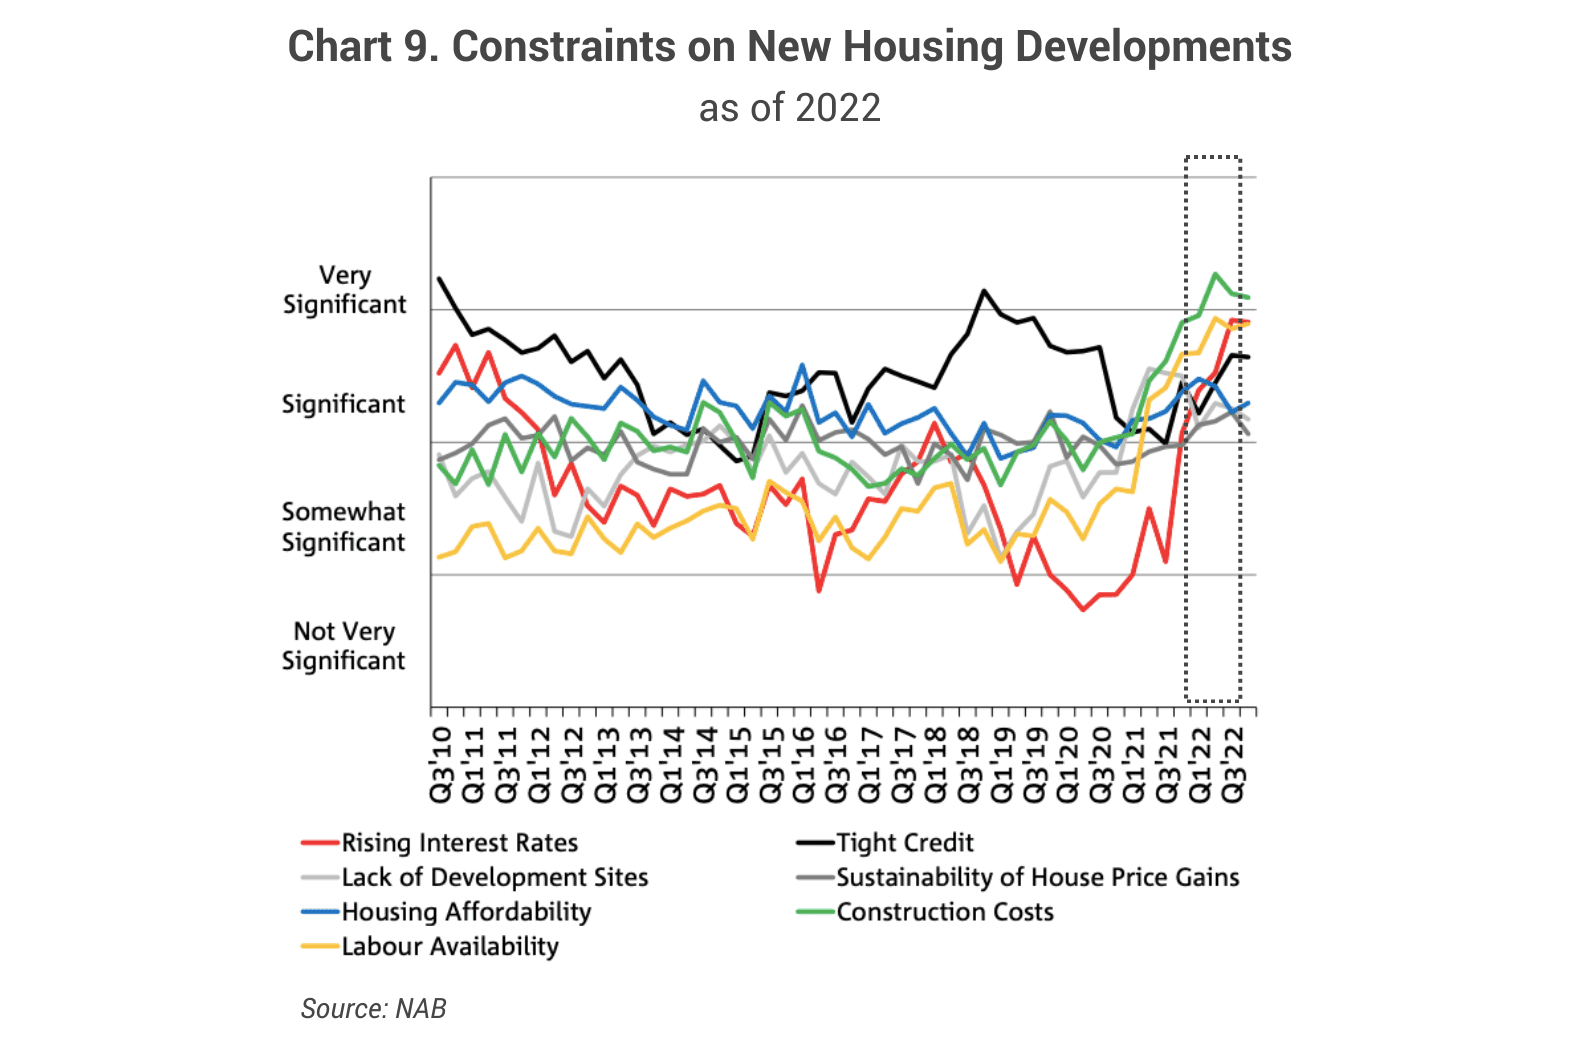
Research conducted by NAB shows that building costs were the biggest impediment to new housing developments, followed by labour availability from mid-2021 to mid-2022 (see Chart 9). The pandemic disrupted global supply chains, causing shortages and higher prices for building materials such as timber, steel, and concrete. Additionally, lockdowns and travel restrictions reduced the availability of labour. As a result, it became more challenging for developers to meet the growing demand for new homes. According to Master Builders Australia, the average time to build a house increased from 8.7 months in 2020-21 to 11.7 months in 2022-23.
To sum up, investors are just one piece of the property market puzzle: Investors represent less than 30% of all property buyers (Chart 6), and they mostly buy in areas where rental demand is high – They are not powerful enough to single-handedly cause price surges. House price booms are caused by a multitude of factors. The COVID boom, for example, was primarily caused by a combination of low interest rates, buyers’ preference shifts, and a severe supply shortage.
Property Investors have positive impacts on the rental market
Property investors play a crucial role in balancing the housing market.
There have always been and will always be needs for rental properties: students, fly-in-fly-out workers, those who choose to live in an area they can’t afford to buy yet, etc. A healthy proportion of investment properties nurtures competition among landlords, leading to reasonable pricing for tenants and preventing excessive rental hikes.
We have discussed why property investors/investment could improve rental affordability with data in a previous blog, Are Property Investors to be Blamed for Housing Unaffordability, where we also listed other reasons why property investment is essential. Check it out here.
Investors have long been misunderstood and suppressed in Australia. The InvestorKit buyers agency has always dedicated itself to clearing property investors’ names and advocating for a healthier housing system with less investor-bashing policies. In the meantime, we are helping hundreds of investors achieve their investment goals fast with our data-driven approach. Need a hand to kickstart your investment journey and increase your chance of success? Chat with us by clicking here and requesting your 15-minute FREE no-obligation discovery call!
.svg)
