As we bid farewell to 2024, what lies ahead for Australia’s property market in 2025?
After a year of high interest rates, with a 4.35% RBA cash rate, and diverse market performance across the country, many investors are asking: What’s next?
In this final blog of the year, let’s unwrap the five key trends shaping Australia’s property market in 2025 and discover how you can stay ahead in a dynamic and evolving landscape.
Trend 1: Demand will continue to favour affordability.
Over the past two and a half years, affordable markets have significantly outperformed their more expensive counterparts (chart below).
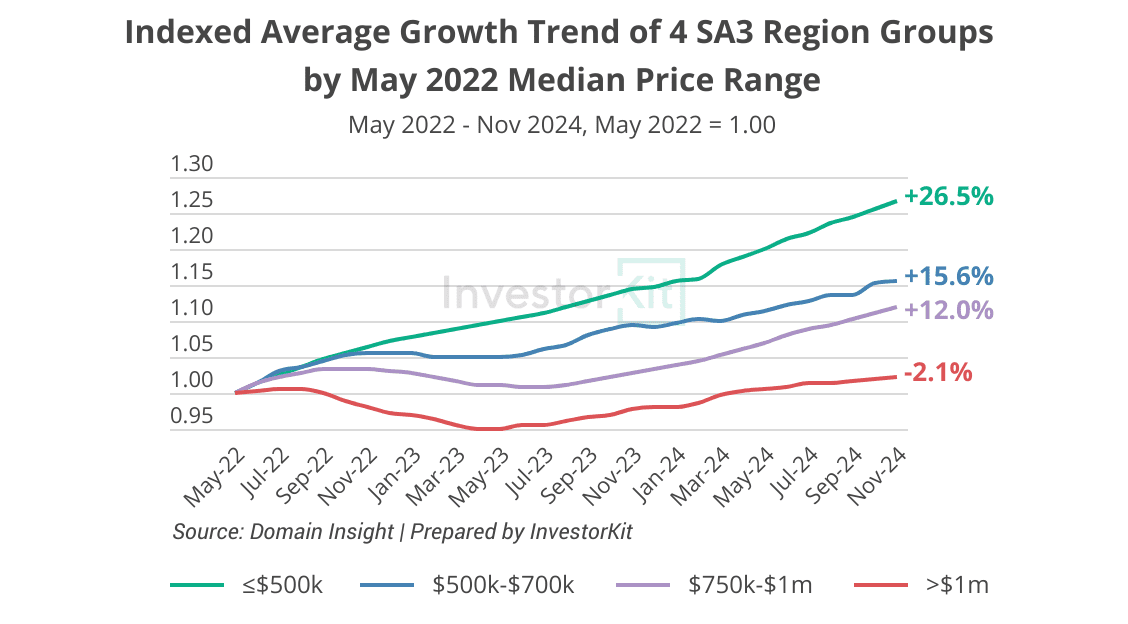
Looking ahead to 2025, even with potential rate cuts, affordable markets are expected to remain highly sought after. States like WA, SA, and QLD will likely retain their popularity, while VIC and NT may attract more interest due to their relative affordability and favourable early-cycle positions.
Two key reasons support this expectation:
First, rate cuts will take time to materialise. The RBA cash rate target is forecast to only decrease by 0.5% to 1% in 2025, so interest rates will remain relatively high throughout 2025, limiting borrowing capacity and serviceability. This is likely to sustain demand for affordable markets as buyers seek value.
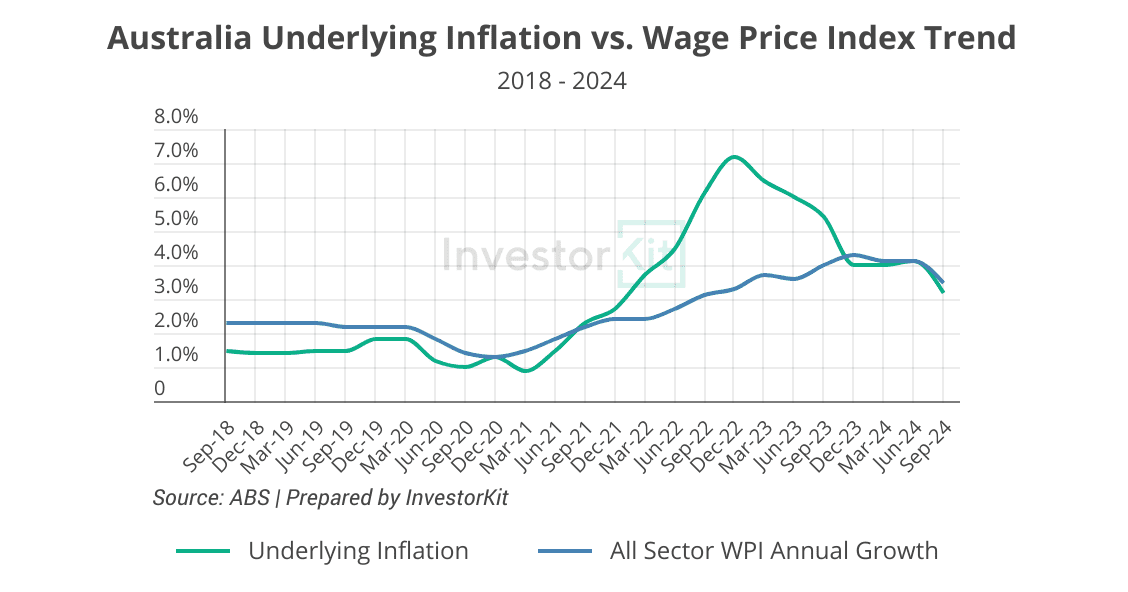
Second, the low household saving ratio needs time to recover. While wages have risen significantly since 2021, inflation outpaced wage growth until late 2023 (chart below). This, alongside rising mortgage expenses and the return to normality after lockdowns, has driven the household saving ratio to its lowest since 2008. In 2024, household savings began to recover as inflation went down. However, the still-low savings ratio will likely continue to steer demand toward affordable markets over high-priced alternatives.
Trend 2: Rental growth will likely continue slowing as affordability pressures mount, but rental supply will remain tight.
Rental growth has been slowing across many submarkets. Among all Greater Capital City Statistical Areas (GCCSAs), only Greater Adelaide and the ACT recorded higher rental growth in the year to November 2024 compared to the previous year.
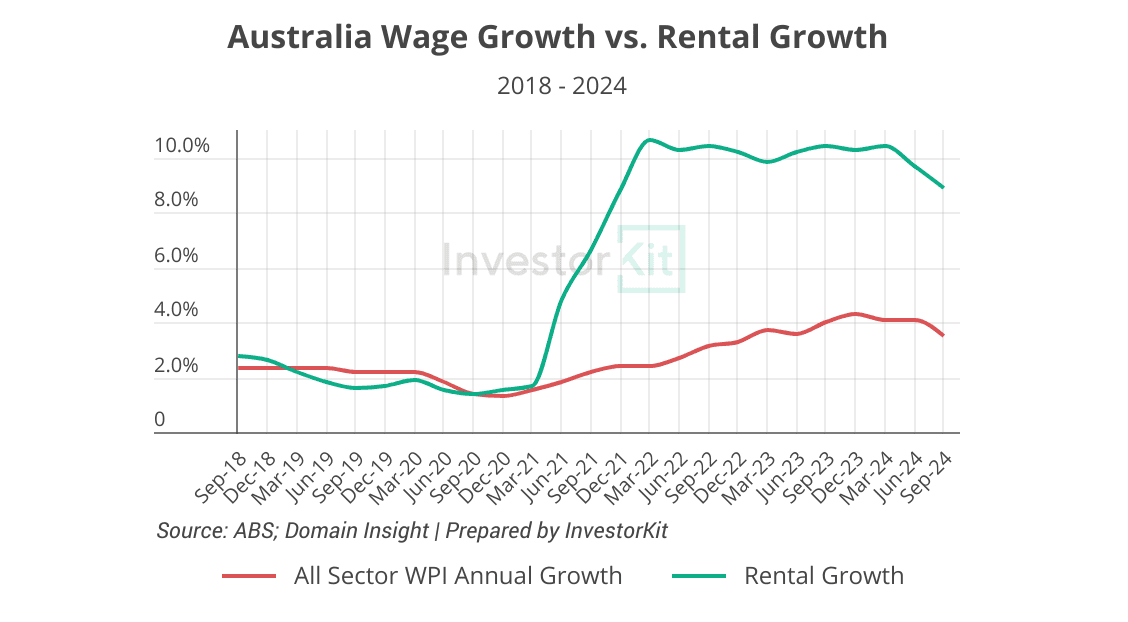
Rental growth and affordability are closely tied to wage growth. With rental growth continuing to far outpace wages (chart below), the slowdown is expected to persist into 2025 as rental affordability worsens.
However, while rental growth is decelerating, vacancy rates will likely remain exceptionally low (chart below). Sub-1% vacancy rates are increasingly becoming the new norm in 2025.
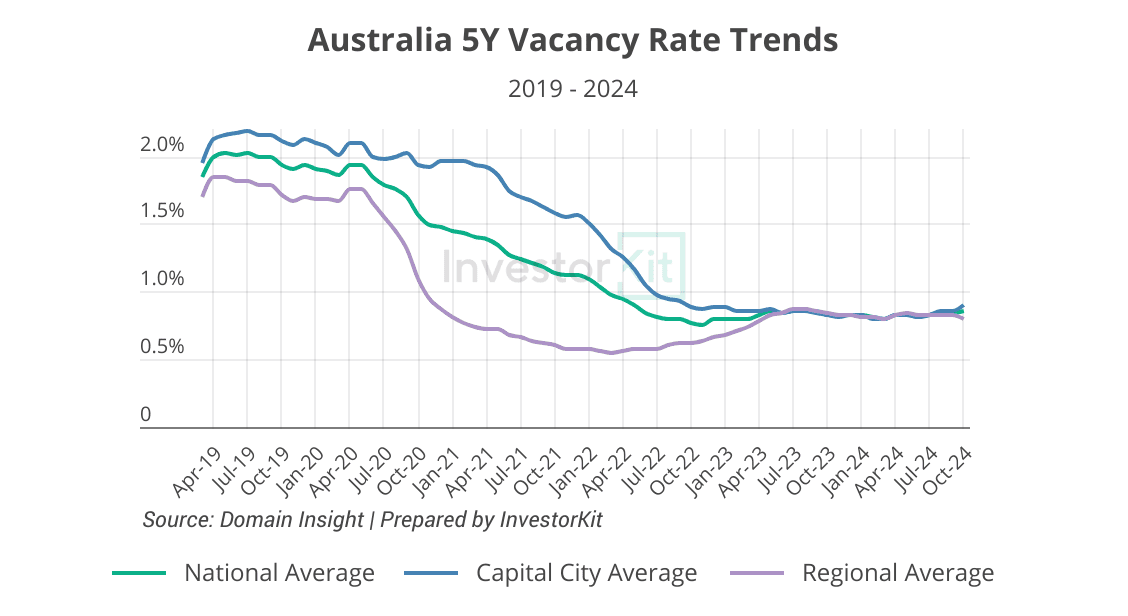
Some of the key causing factors of the persistently low vacancy rates are:
- Fast population growth driven by a strong influx of overseas migrants.
- Reduced household size, despite a slight recent increase.
- A significant decline in private rental property stock due to subdued investor activity. While stock levels have improved slightly (see the bottom-right chart), they remain well below the decade average.
- Lack of social housing and Build-to-Rent developments.
- Insufficient new housing supply, constrained by high construction costs and a shortage of skilled labour.
- Increased internal migration to popular regions where rental supply is unable to meet surging demand.
As none of the above factors can be addressed in the short term, we expect Australia’s rental vacancy rates to stay low in 2025 even as rental growth continues to slow. The tight rental market and elevated rental prices will likely push more housing demand towards the sales market, contributing to sales price growth across many submarkets.
Trend 3: Strong rental growth and improving yields will drive recovery in slower-moving markets.
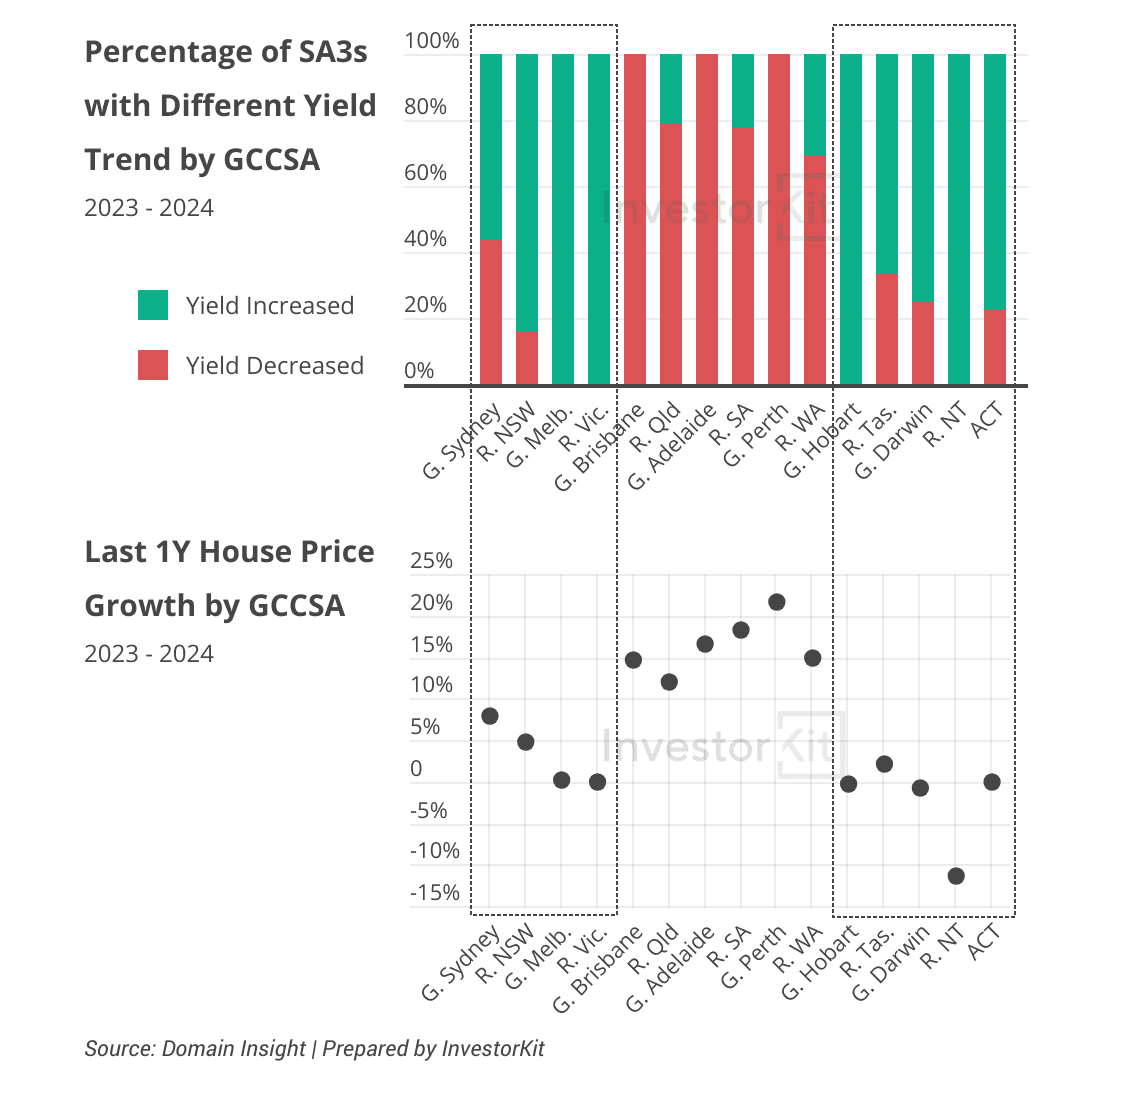
In 2024, rental growth has outpaced price growth in 169 SA3 regions out of 332 with valid market data, leading to increased rental yields. Of these, 154 regions are located in slower-moving states: NSW, VIC, TAS, ACT, and NT (chart below). As yields improve, investor activity is expected to increase, shifting housing demand from the rental market to sales. This effect will be particularly pronounced in regions offering moderate yields (3.5–4.5%).
As of November 2024, 109 out of 332 SA3 regions offer yields between 3.5% and 4.5%, up from 97 last year. Of these, 94 (86%) are located in NSW, VIC, QLD, and Greater Adelaide, with particular concentration in NSW’s coastal regions, Melbourne, Brisbane, Gold Coast, and Sunshine Coast, where house prices typically range between $600k and $1.1m (chart below).
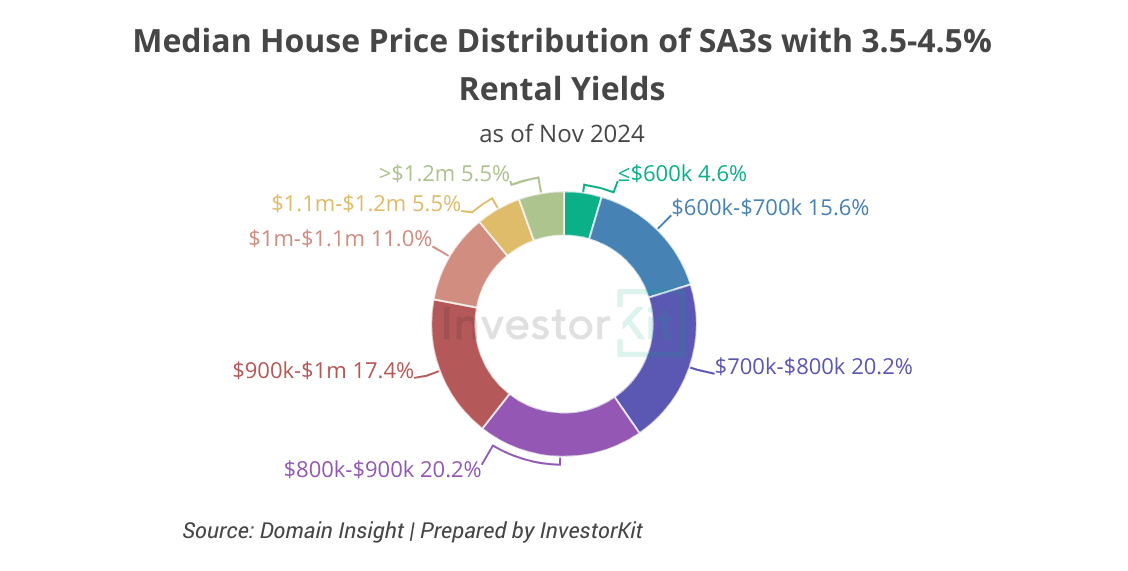
Historically, these higher house prices and lower rental yields have discouraged investors and kept renters in the rental market longer. However, as rental growth continues to outpace price growth, improving yields are gradually attracting investors back. At the same time, worsening rental affordability is pushing renters to consider buying, making homeownership a more viable option. Together, these trends are driving demand towards the sales market and strengthening price growth.
Furthermore, while smaller regional markets like Townsville and Bunbury have proven their performance, many mum-and-dad investors are still waiting for opportunities in major markets within the $600k–$1.1m price range. With interest rates expected to fall and rental yields likely to improve further in 2025, these moderate-yield markets are poised to gain popularity and experience stronger growth than they did in 2024. However, it will likely take beyond 2025 for it to materialise into larger gains.
Trend 4: Regional property markets will remain strong as regional migration continues.
The Sep 2024 Regional Movers Index Report reveals that 35.6% more people moved from capital cities to regional areas than in the opposite direction in the last quarter, and the Regional Movers Index is now close to 20% higher than the pre-COVID average (chart below).

Regional NSW, VIC, and QLD continue to lead in net internal migration inflows, while Sydney and Melbourne remain the primary sources of regional relocators.
The persistently high level of regional migration is largely driven by rising living costs post-COVID and tightened job and housing markets in the largest cities. In contrast, smaller capital cities and regional areas benefit from lower living costs and abundant job opportunities. As shown in the chart below, job opportunities in Sydney and Melbourne are only 14% higher than at the start of 2020, whereas they have increased by 81% in smaller capitals and 98% in regional areas.
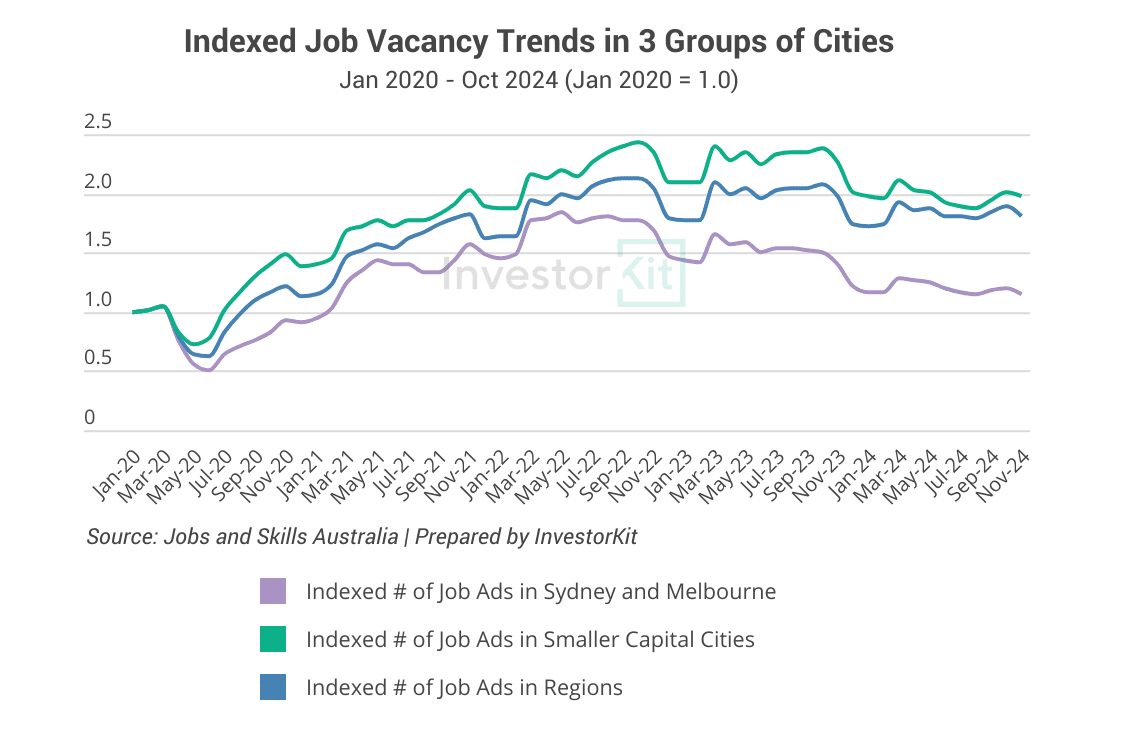
With regional migration trends remaining strong, housing demand in regional markets is expected to stay robust in the coming years.
Trend 5: Price gaps between quartiles are expected to widen again as the upsizing trend gains momentum.
Since the RBA began raising the cash rate target, demand has shifted towards more affordable properties, leading to stronger growth in this segment. The chart below shows that in 7 out of 8 capital cities — except Sydney, where the median price performed best — the lower quartile outperformed both the median and upper quartile prices over the two years to November 2024.
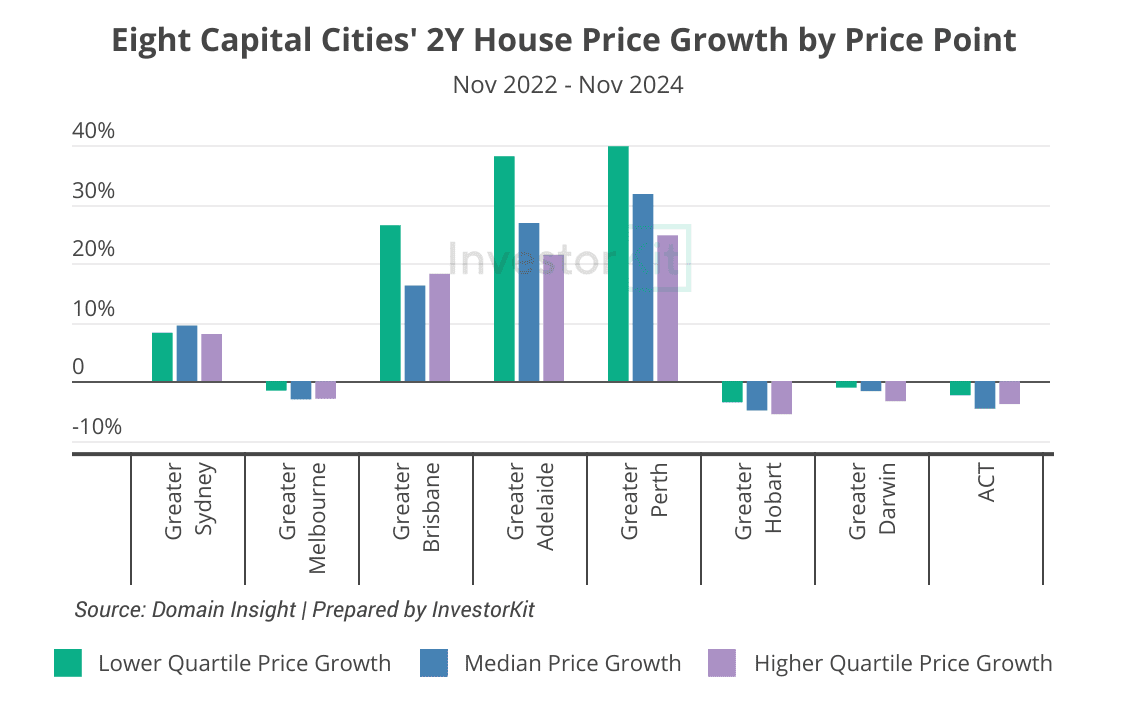
In 2024, while lower-quartile properties continued to lead growth, the upper quartile experienced a notable recovery in many hotspot markets. This recovery is being driven by an emerging upsizing trend within these markets:
Over the past two years, affordable areas (typically outer-ring suburbs) and smaller houses in cities like Brisbane, Perth, and Adelaide have experienced significantly stronger value growth than their more expensive counterparts. Many homeowners are now leveraging their capital gains to sell outer-ring or smaller homes and upgrade to closer-to-city areas or larger homes that they couldn’t afford previously.
Adelaide exemplifies this trend. Over the past 12 months, higher-priced SA3 regions in Greater Adelaide have seen higher sales volume increase (chart below), faster days on market decline, and more vendor discount decrease, all indicating growing momentum in the higher-priced submarkets.
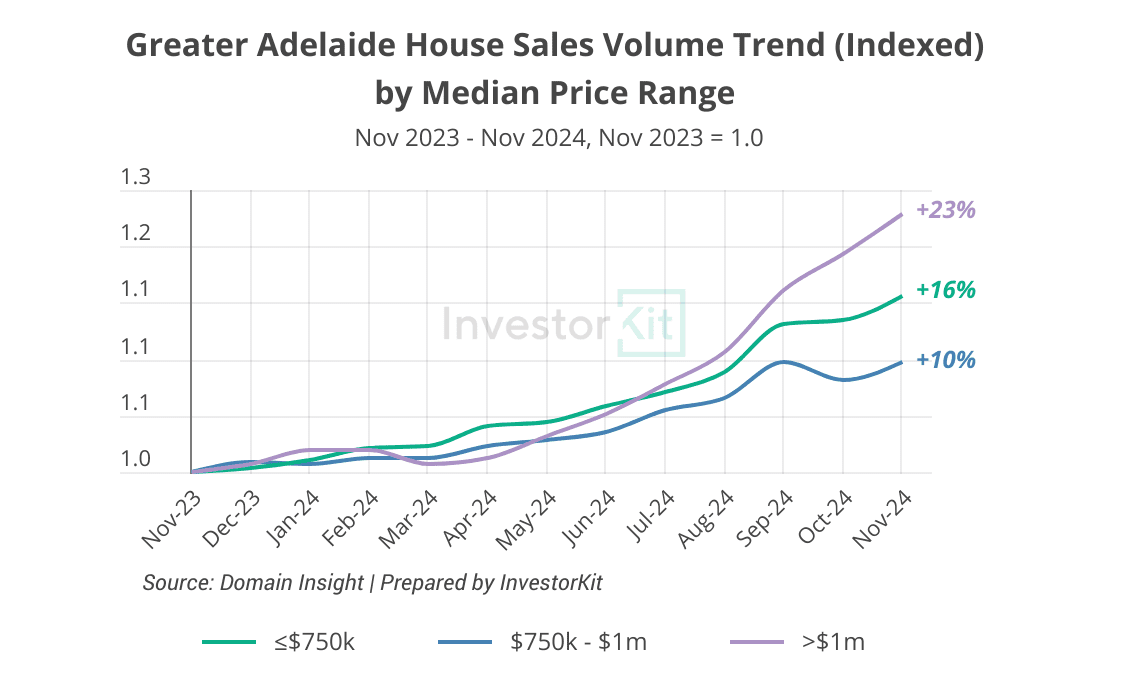
Looking ahead to 2025, as affordable submarkets continue to experience strong capital growth and rate cuts improve affordability, the upsizing trend is expected to gain further momentum and become more widespread across Australia.
The five trends outlined above are just the beginning. To dive deeper into Australia’s property market 2025, including two more critical trends and a reflection on our 2024 predictions, download your free copy of our ‘7 Trends That Shape Australia’s Property Market in 2025’ whitepaper.
InvestorKit is your trusted partner in navigating Australia’s evolving property market. With data-driven insights and a tailored approach, we empower investors to make informed decisions and achieve long-term success.
Ready to make 2025 your year? Book a FREE 15-minute discovery call today, and let’s start building your property portfolio.
Wishing you a Happy New Year and a prosperous 2025!
Table of Contents
- Trend 1: Demand will continue to favour affordability.
- Trend 2: Rental growth will likely continue slowing as affordability pressures mount, but rental supply will remain tight.
- Trend 3: Strong rental growth and improving yields will drive recovery in slower-moving markets.
- Trend 4: Regional property markets will remain strong as regional migration continues.
- Trend 5: Price gaps between quartiles are expected to widen again as the upsizing trend gains momentum.
.svg)
