“I heard this suburb has a lot of public housing — Should I avoid it?”
This is a common question among property investors. Public housing often brings images of unsafe neighbourhoods and poor market performance to mind, but is that perception rooted in truth or myth?
In this article, we’ll let data talk and determine whether public housing proportion affects property market growth.
What is public housing?
Public housing is government-subsidised short and long-term rental housing owned by State and Territory Governments.
It is a type of social housing available to people on very low incomes and who often have experienced homelessness, family violence, or have other complex needs.
According to the Future Directions for Social Housing in NSW report, public housing, to facilitate the needs of its residents, should be close to public transport, green space, education and public health services. These traits are also what would enhance a suburb’s livability.
While some suburbs with extremely high proportions of public housing (eg. Airds in southwest Sydney, with public housing taking 59% of its total dwelling units) may not have the above traits, most suburbs with a reasonable amount of public housing do.
Does Public Housing Increase Crime Rates?
It’s a common belief that higher public housing percentages lead to higher crime rates, but data says otherwise.
A study commissioned by the NSW Department of Public Housing in 1997 found that “neither the proportion, type or design of public dwellings in a postcode exerts any significant independent effect on its crime rate.”
Fast forward to 2024, and the latest data reinforces this finding.
The chart below shows the relationship between NSW suburbs’ public housing proportion and crime rates (crime rate = total # of criminal incidents in the past 12 months ÷ population) as of the end of 2024.
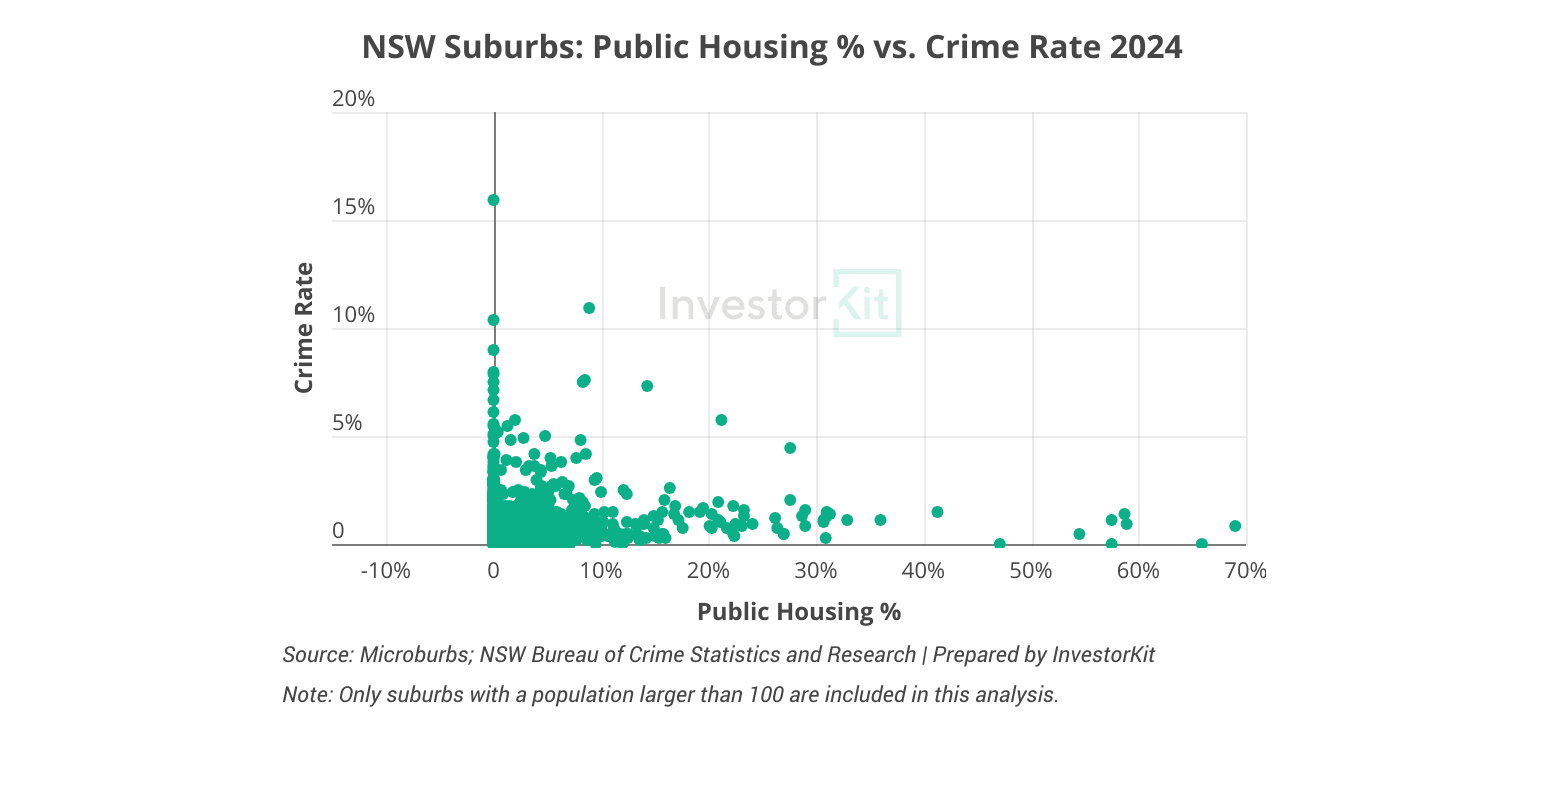
It’s clear that
- Most (18 out of 24) of the suburbs with >5% crime rates have a lower than 2% public housing proportion;
- No trend suggests crime rates increase with public housing percentages.
Does Public Housing Lower Property Value Growth?
The short answer is No. More precisely, public housing proportions may correlate with property value growth in the short term but not in the long term.
I’ll demonstrate with two examples: Sydney and Perth.
Sydney’s Sales Market
Short-term patterns
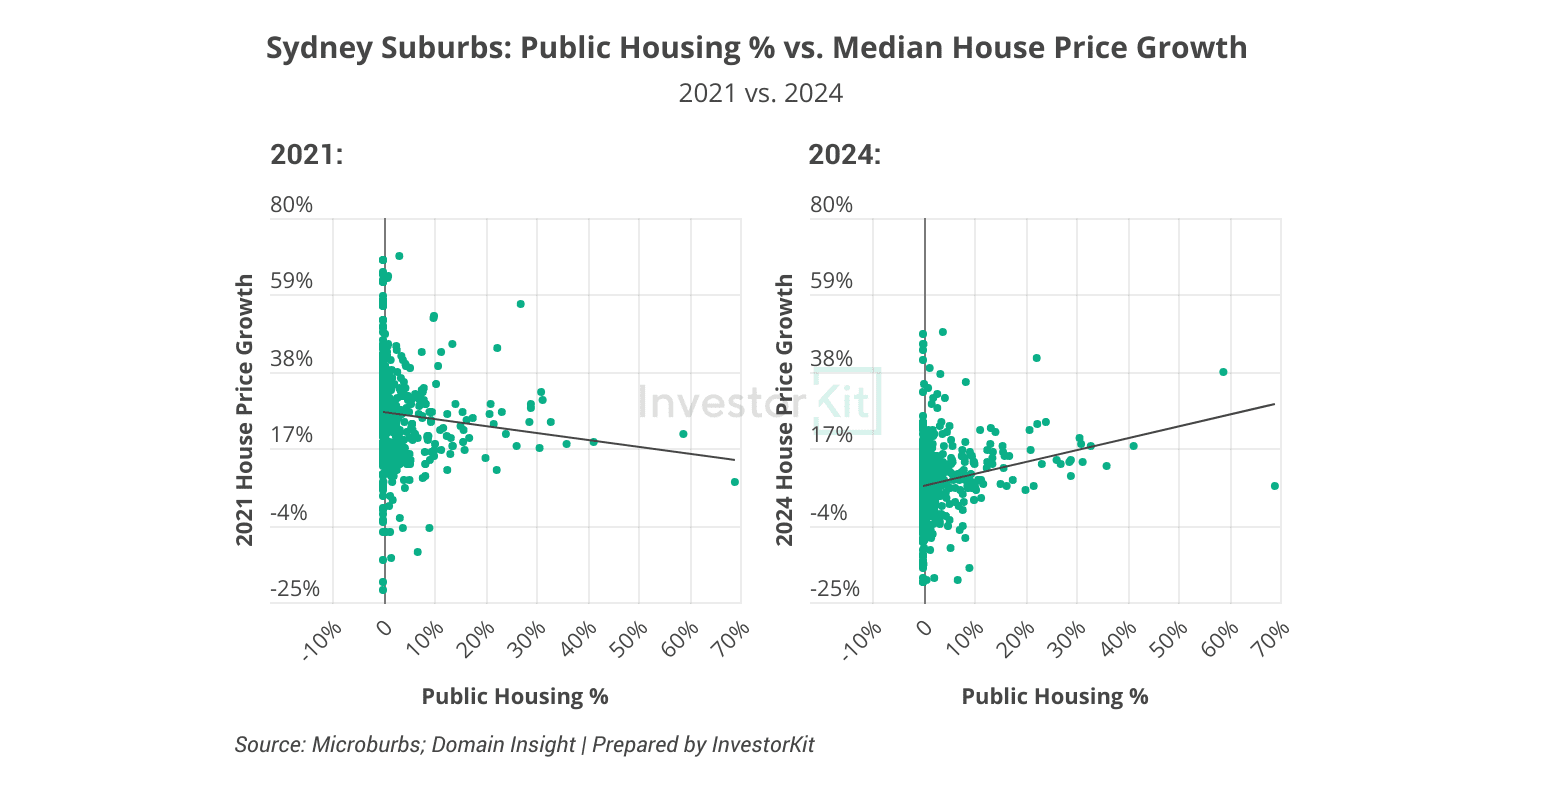
- Negative correlation in 2021: Sydney’s property market benefitted from the historically low 0.1% interest rate and started booming in 2021. The boom was led by more affluent suburbs (with low public housing %); thus, the lower the public housing %, the better growth (left-hand side chart below).
- Positive correlation in 2024: In 2024, Sydney’s property market was constrained by high interest rates and poor affordability. This year, affordable suburbs, where public housing proportions tend to be higher, had grown faster. The p-value of 0.000 (a correlation is statistically significant when the p-value < 0.050) indicates a strong correlation statistically (right-hand side chart below).
Long-term pattern
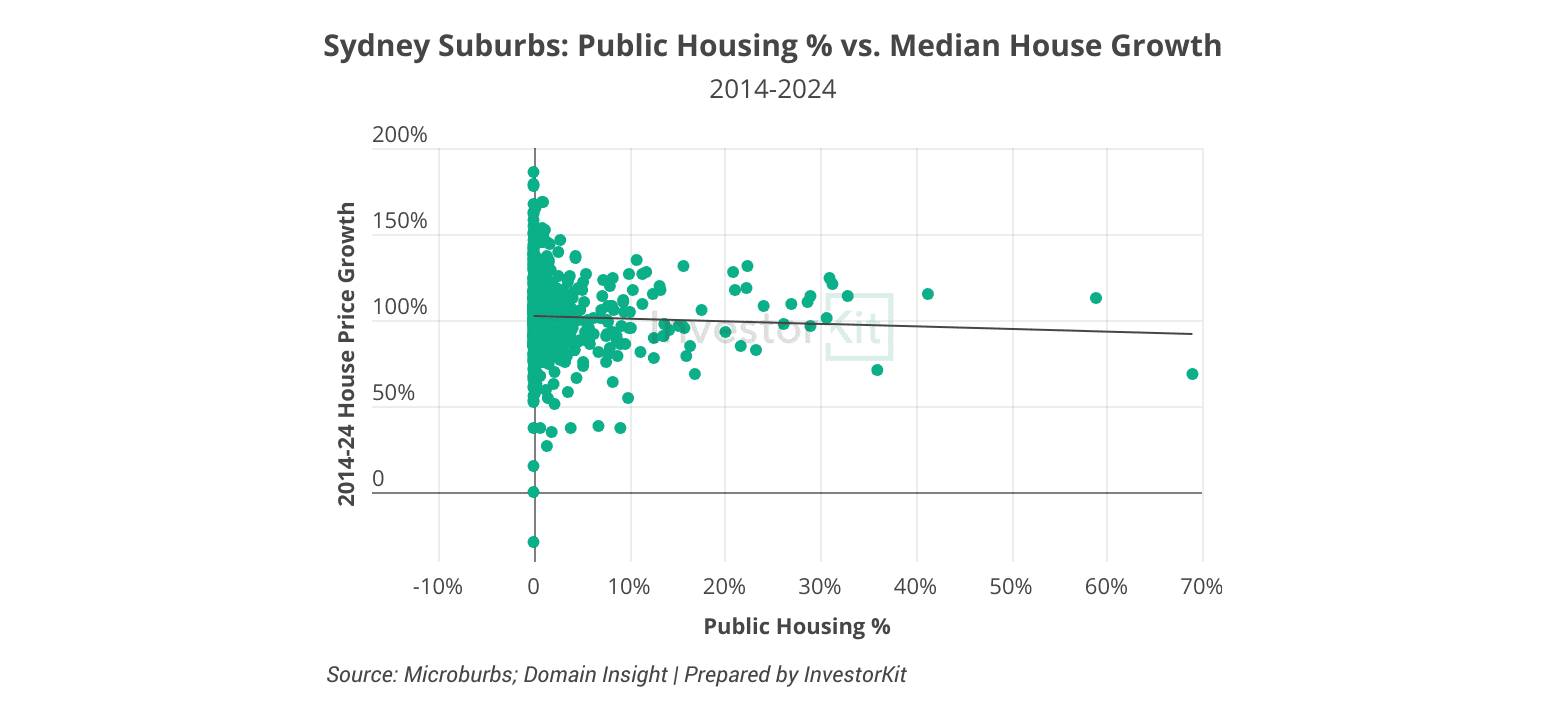
In the long term, total growth converges as all suburbs get their moment to shine. The chart below shows that public housing percentages in Sydney have no significant impact on house price growth (p-value = 0.114).
Perth’s Sales Market
Short-term patterns
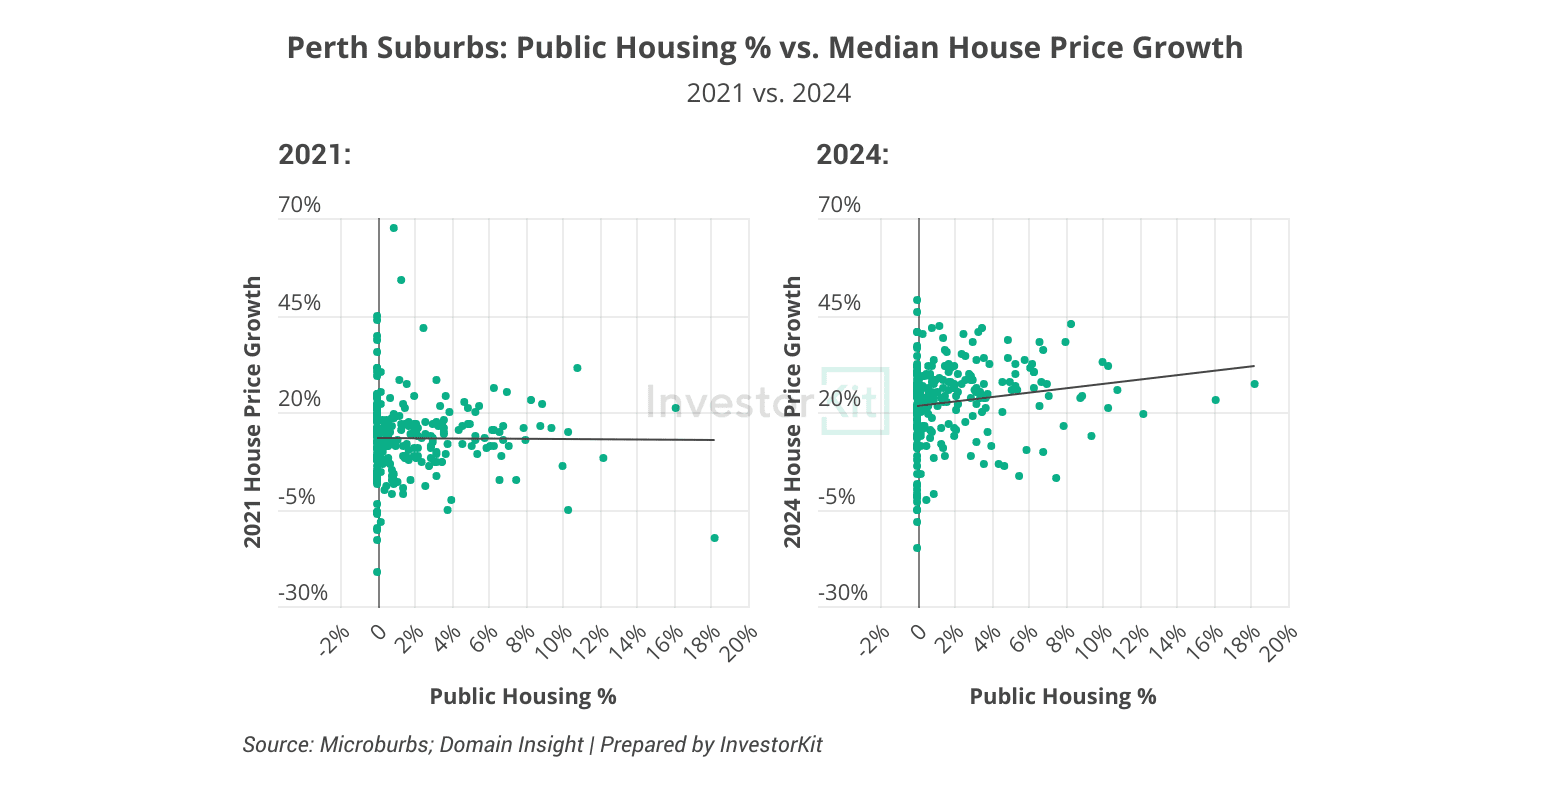
- No correlation in 2021: Perth’s property market was slowly recovering in 2021 and there was no clear pattern of which suburbs outperformed which (left-hand side chart below).
- Positive correlation in 2024: While Perth’s property boom continued in 2024, the price surge in the previous 2 years made many suburbs unaffordable. Therefore, under the influence of the high interest rates, Perth saw a similar, but not as clear, pattern as in Sydney: affordable suburbs with higher public housing % grew better than the more affluent ones (p-value = 0.013, left-hand side chart below).
Long-term pattern
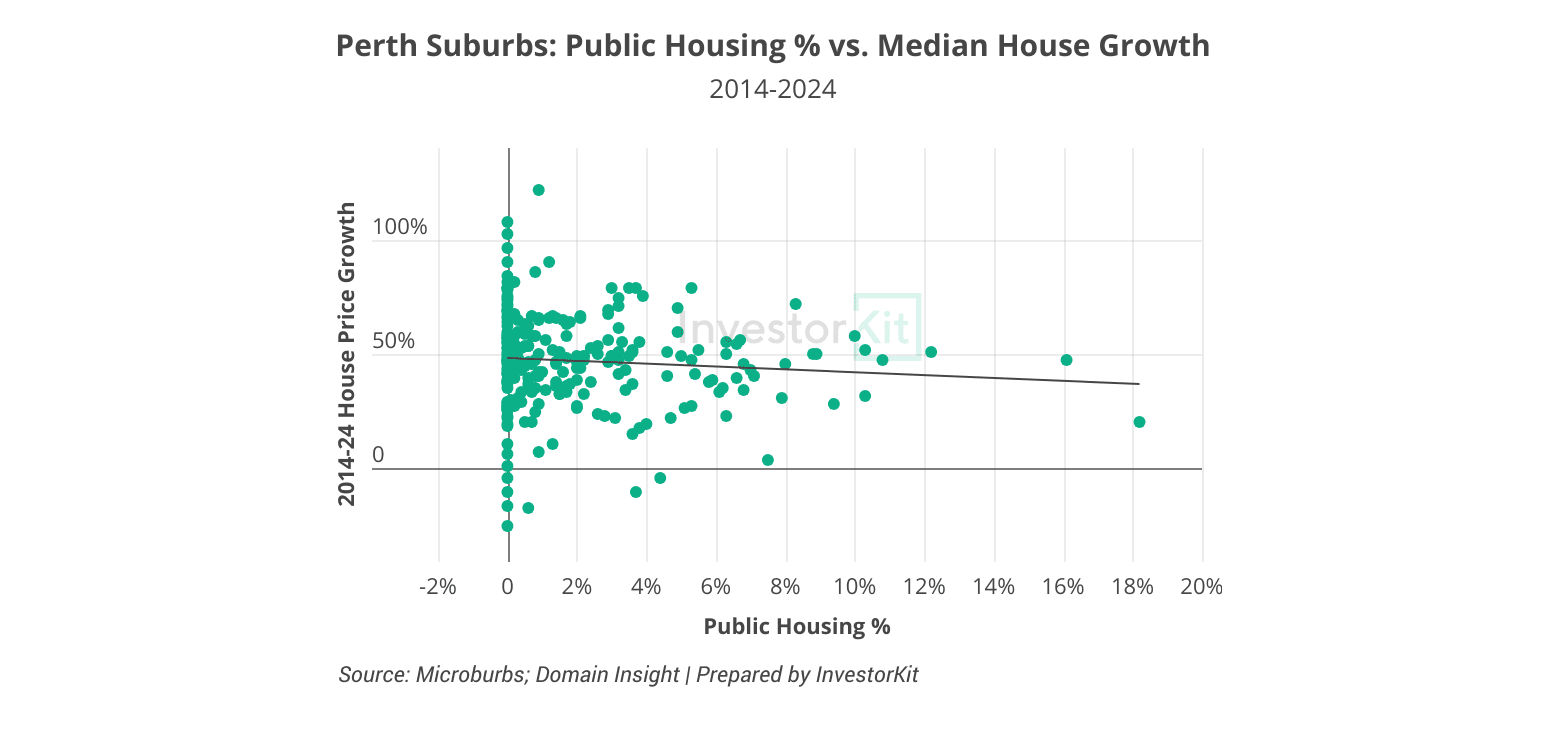
Like Sydney, Perth suburbs’ public housing percentage and their 10-year house price growth do not show a statistically significant correlation (p-value = 0.119, chart below).
Does Public Housing Lower Rental Growth?
You may have guessed the answer: No in the long term, while positive or negative correlations could exist in the short term.
Sydney’s Rental Market
Short-term patterns
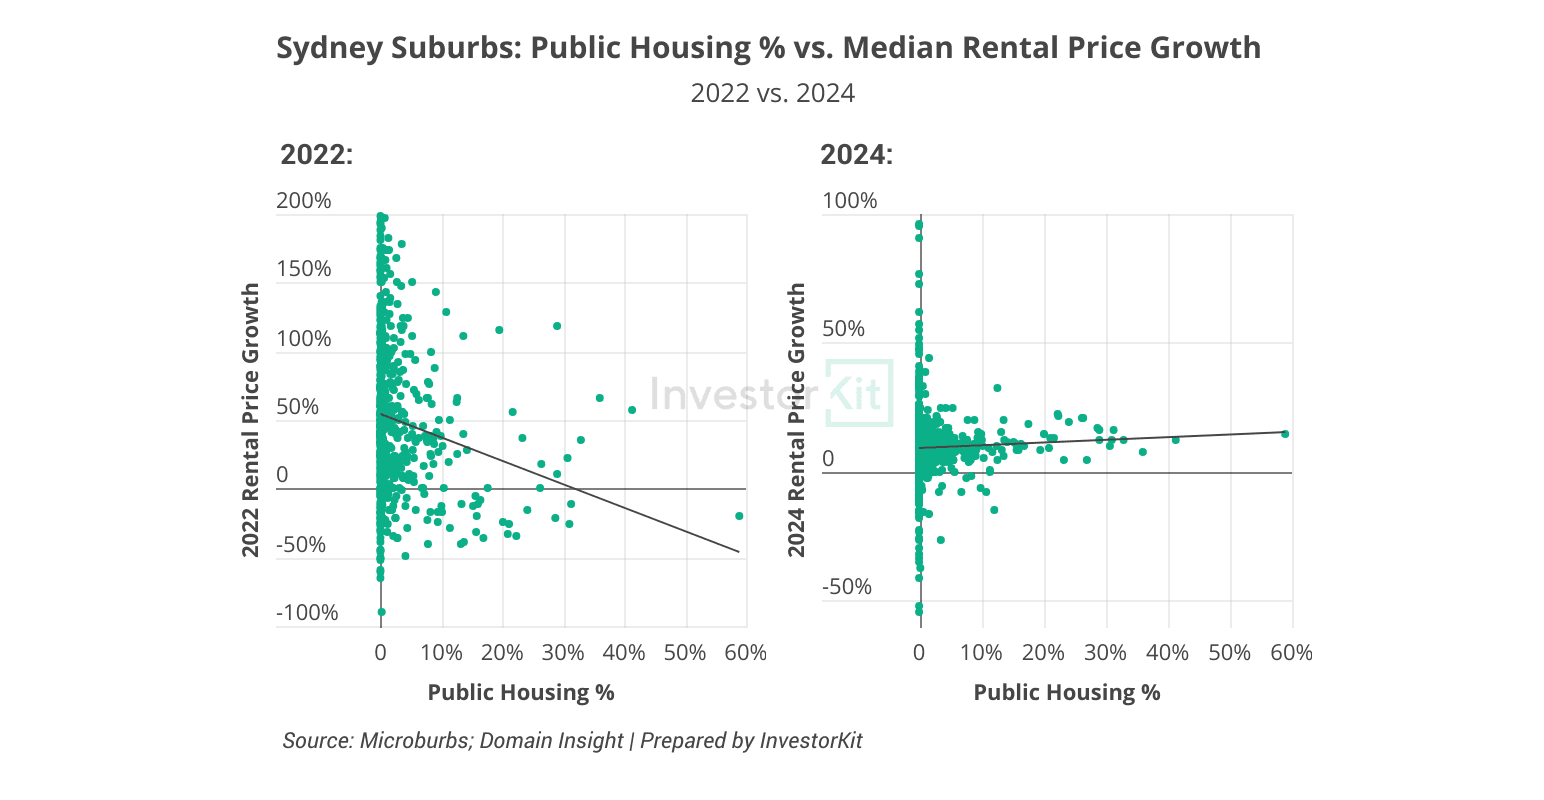
The below charts show a strong negative correlation between public housing % and annual rental growth in 2022, at the beginning of the national rental boom (p-value = 0.000), and an insignificant positive correlation in 2024 (p-value = 0.172), when the rental market slowed as affordability constraints took effect.
Long-term pattern
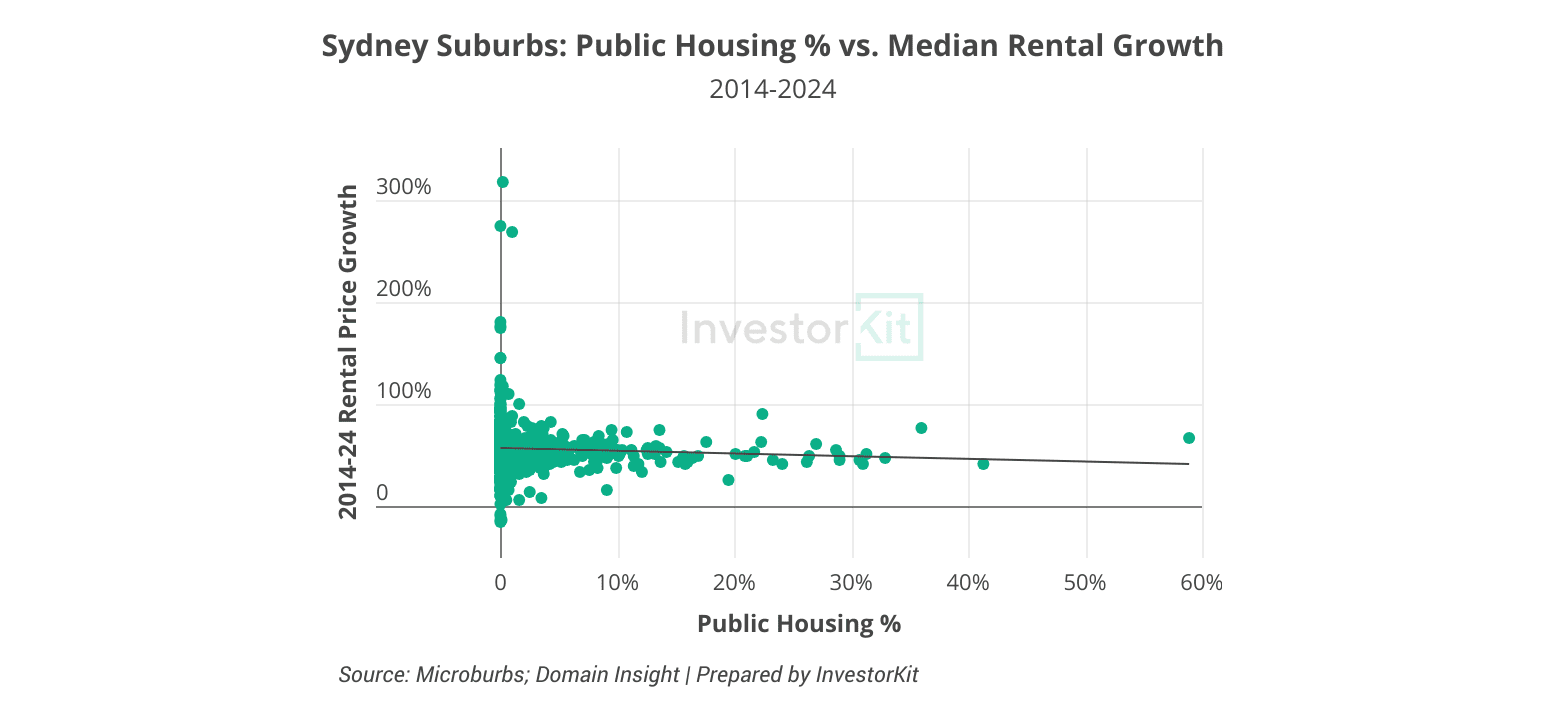
With a coefficient of -0.27 (slope of the trendline) and a p-value of 0.113, Sydney suburbs’ public housing % does not significantly correlate with their 10y rental growth.
Perth’s Rental Market
Short-term pattern
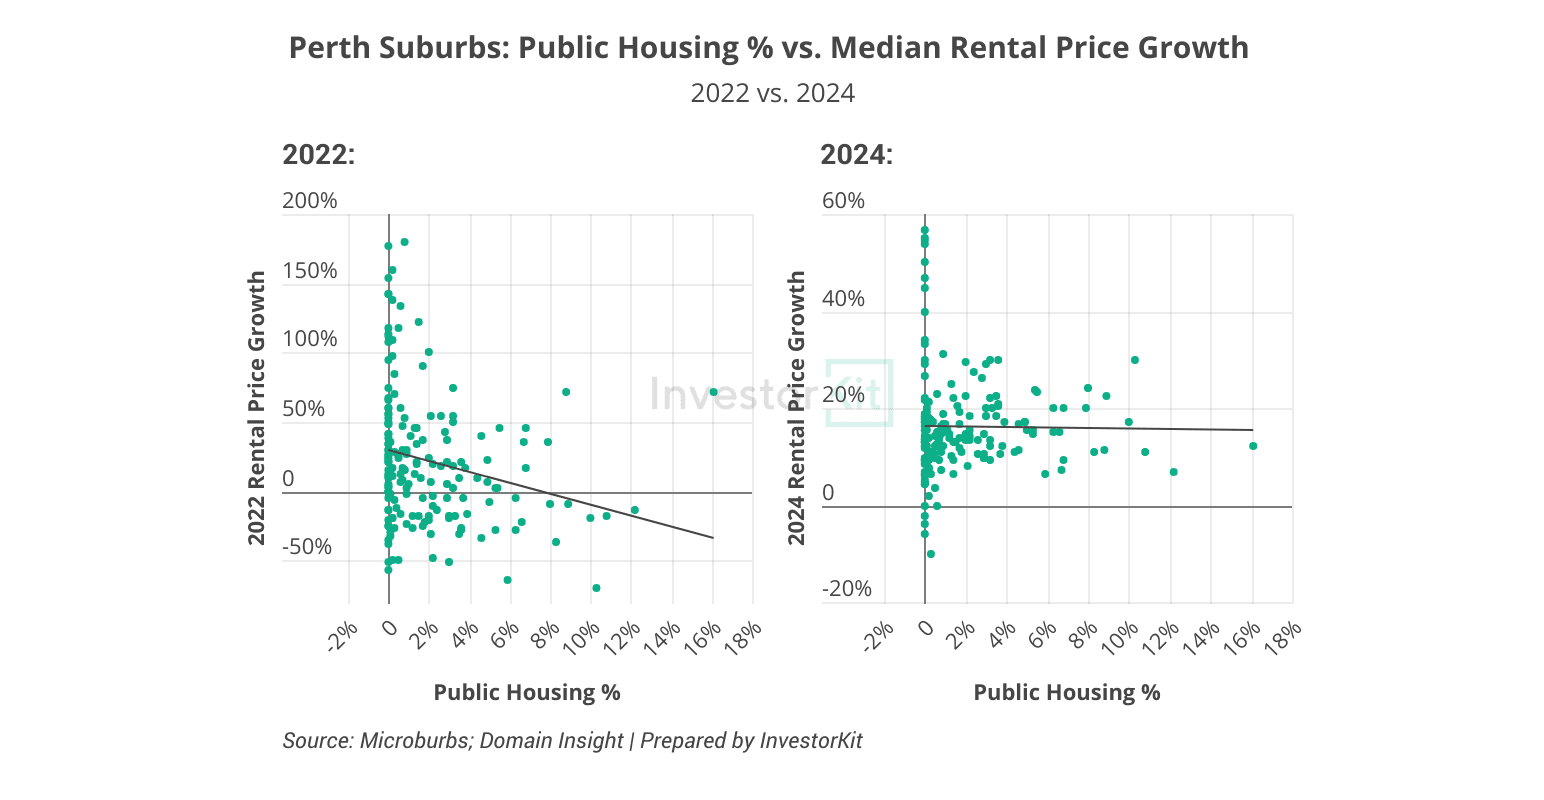
Similar to Sydney, Perth suburbs’ public housing % and annual rental growth demonstrated a strong negative correlation at the beginning of the national rental boom (p-value = 0.009, left-hand side chart below) and an insignificant negative correlation in 2024 (p-value = 0.620, right-hand side chart below).
Long-term pattern
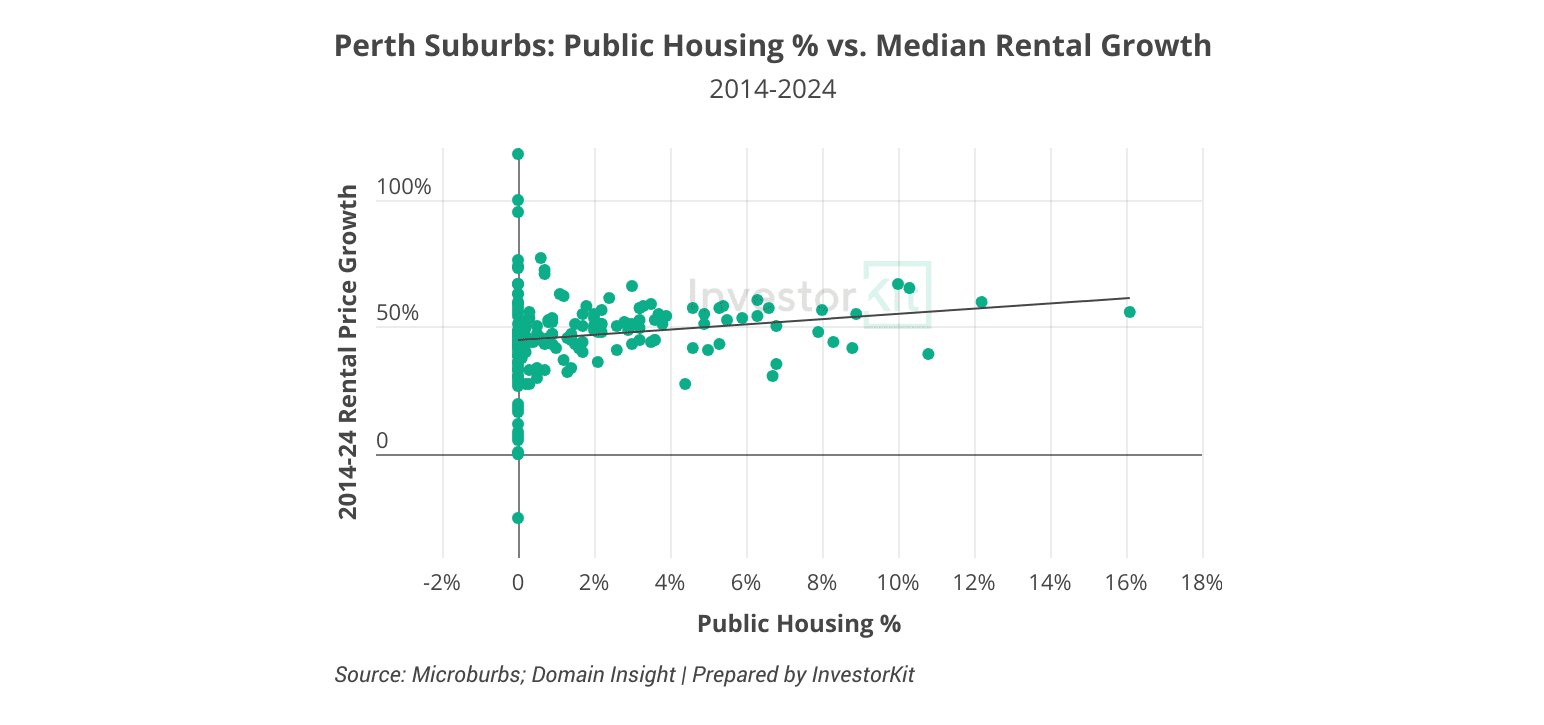
With a coefficient of 0.95 and a p-value of 0.04, Perth suburbs’ public housing % and their 10y rental growth show a positive correlation that is statistically significant (chart below). This could be because of the gentrification happening in the inner-ring and middle-ring suburbs, where public housing was concentrated, in the past decade. This correlation will likely weaken as the examining period further lengthens.
Conclusion: Public Housing Shouldn’t Be Your Major Concern
Australia urgently needs more public housing to ease the national rental crisis. As a result, we will inevitably see more public housing projects in well-connected and well-serviced areas. As an investor, should you avoid buying in these areas?
No. Data has shown that public housing proportion doesn’t make a suburb unsafe (it doesn’t affect the crime rate), and in the long term, public housing proportion won’t cause lower value growth or rental growth.
What’s more, potential gentrification, urban renewal, infrastructure improvement and the consequent demographic shifts can even benefit suburbs with public housing projects. An example is the Perth suburb’s last 10-year rental growth (as shown in the above section).
InvestorKit is a buyer’s agency dedicated to cutting off the noise for investors and helping you focus on what really matters. We spend hundreds of thousands of dollars each year on data and research to monitor the key factors that have real impacts on the property market’s growth and help you grow your wealth in the most efficient way — Interested in how our research work? Talk to us today by clicking here and requesting your 15-min FREE no-obligation discovery call!
.svg)
