4.25% cash rate rise in one year and a half is the fastest increase in the RBA’s history, bringing many mortgage borrowers and property investors increased pressure levels, if not trouble.
In a previous article, we discussed why the lifted interest should not stop your investment journey. In this article, we will share the No.1 tip that will help you achieve property investment success in this high interest environment:
Undersupply
During times of uncertainty, you want to look for certainty. We all know that demand and supply drive prices in the property market. Which of the two offers more certainty among the two factors?
Demand is driven by population growth, increase in income, greater credit availability, lower acquisition costs (tax & fees), buyer confidence and more. The higher the demand, the more likely prices would grow.
Supply is influenced by the number of for sale, rent, and construction. The lower the supply, the more likely prices would grow.
In a high interest rate environment like today, many demand drivers are either weakened or need a long-term view to become effective. Therefore, supply analysis has more certainty than demand. Instead of operating on areas where speculation is key or solely demand-driven, supply level analysis gives investors more confidence.
We look for three signs: undersupply for sale, undersupply in construction, and undersupply for rent.
Undersupply for Sale
Listings for sale may be the most direct way to examine established supply levels; it also has the highest weighting to supply data. We like to call it ‘established supply’ and analyse in 3 ways:
- Current for-sale listings vs change against 1 year ago or change in the past 3-5-7-10 years.
Eg. Adelaide’s for-sale listings are 1% lower than a year ago, 36% lower than 3 years ago (just before the COVID property boom), and 48% lower than 10 years ago.
- Stock on market as a proportion of total properties in the area.
Eg. Greater Adelaide’s current house stock on market represents 0.88%, which is a very low level, of all houses in the Greater Capital City region.
- Stock for sale compared to what sells each month on average.
Eg. Greater Adelaide currently has a low inventory of 1.9, meaning the current stock for sale is 1.9 times its monthly sales volume.
We find a negative correlation between SA3s’ current (2022) established supply levels and their latest 1-year price growth (below chart).
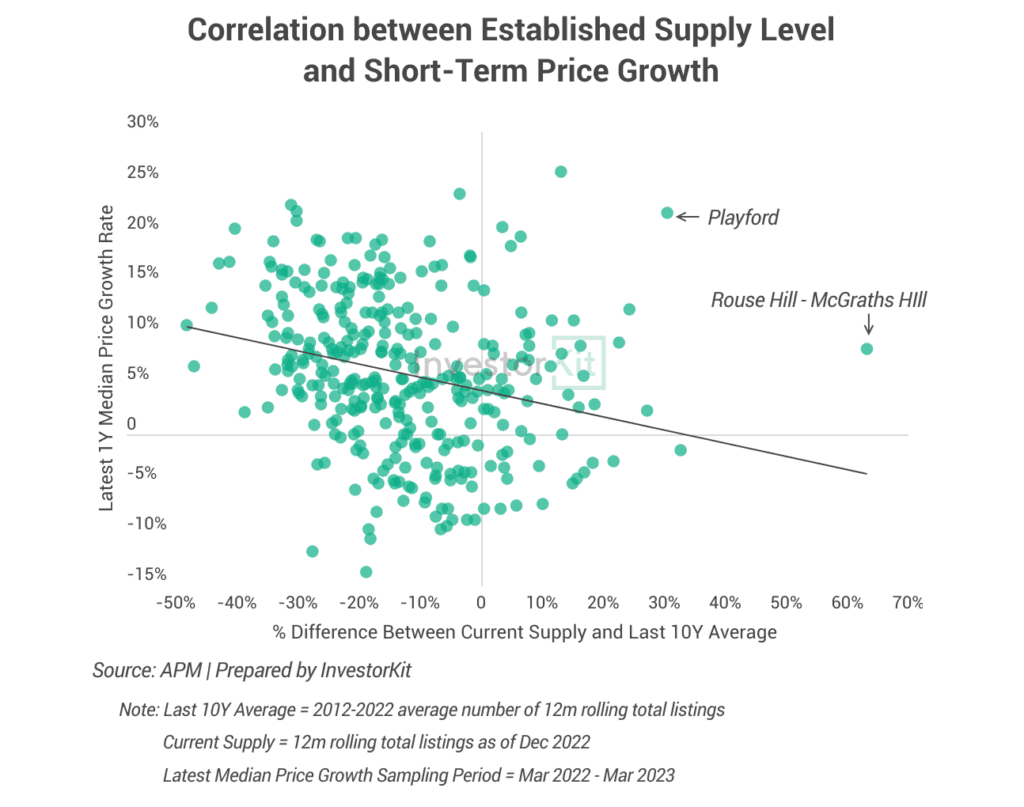
An SA3 with an established supply level lower than its past-10-year average tend to perform better than an SA3 with a higher-than-past-10-year-average supply.
You may have noted two outliers in the above chart: Rouse Hill – McGraths Hill and Playford. They both feature a large number of newly built houses and empty lots for house-and-land packages, thus the high supply level. In the past year, their relative affordability has helped them achieve even more robust growth than some well-established regions.
Undersupply for Building
Another important indicator is incoming supply, representing new listings in the coming 1-2 years. We measure incoming supply by measuring Building Approvals. Precisely, we calculate a ‘Building Approval rate’, which is income Building Approvals as a percentage of the total established stock of the area.
There is no clear correlation between the Building Approval rate and price growth, as shown in the below chart. In other words, regions with high Building Approval rates can enjoy high price growth if other market indicators come together well (eg. Playford and Gawler in Adelaide).
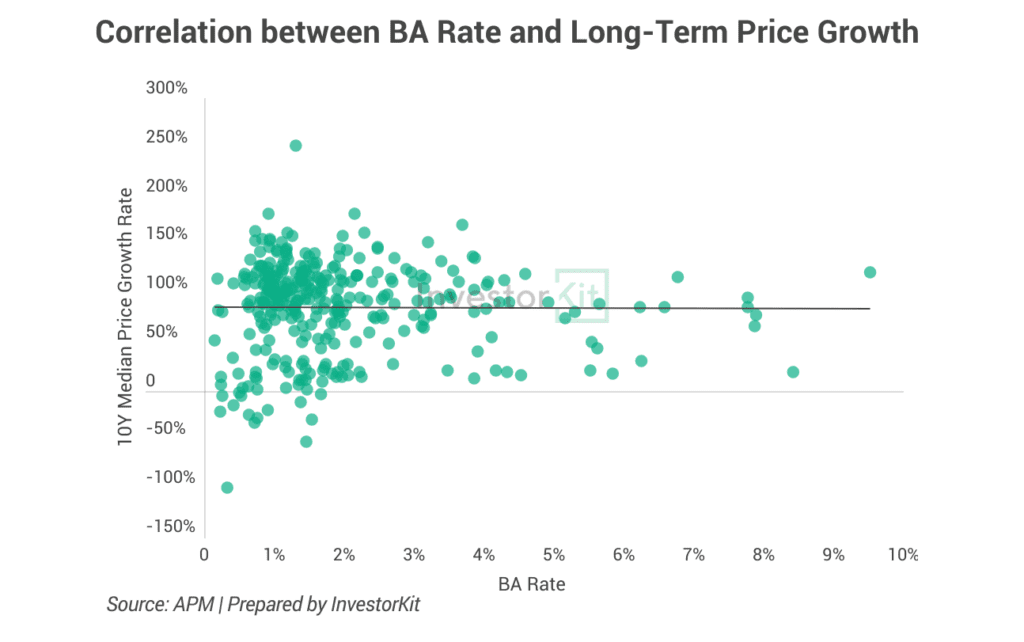
However, low Building Approval rates provide more certainty and are a great add-on if other indicators look good.
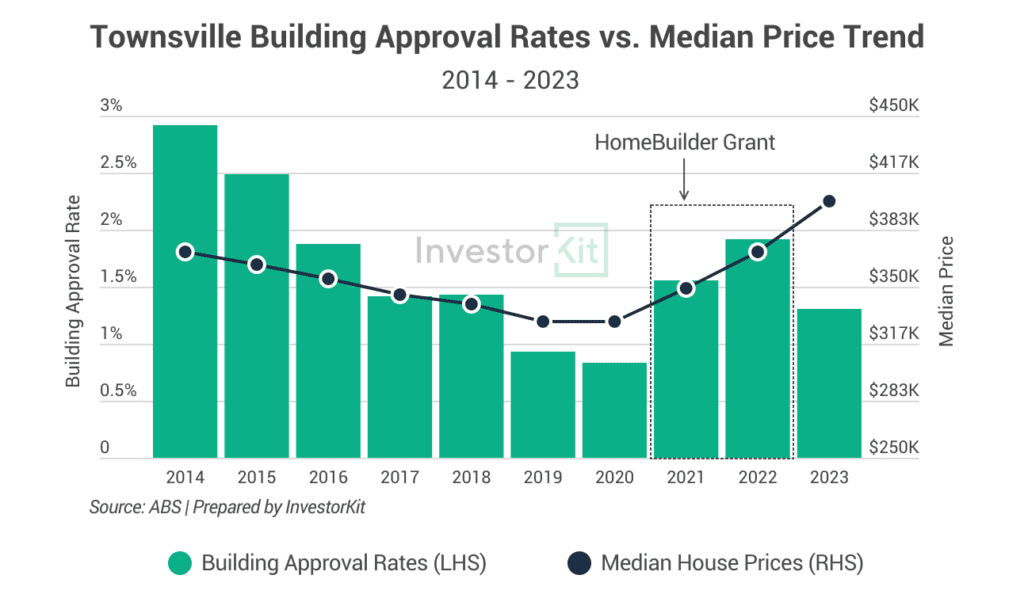
An example is Townsville.
Townsville’s suppressed economy started recovering in 2016. The city now enjoys the lowest unemployment in over a decade and a strong infrastructure pipeline. In the property market, demand is growing faster than supply in both sales and rental markets, leading to decreasing sale days on the market and rental vacancy rates. All these influencers indicate that Townville’s property market is on its way to becoming a Hotspot.
Guess what adds more certainty to its growth? Declining incoming supply. In the past decade, Townsville’s new house-building approvals have been trending downwards (chart below). The decrease in new construction activities resulted from a cooled-down local economy and, at the same time, rebalanced the market supply and demand toward its next growth phase.
Undersupply for Rent
Vacancy rates examine the current rental market supply level. Low or declining vacancy rates lead to healthy rental growth, which benefits your cash flow position and reduces mortgage repayment pressures in a high interest rate environment. They can also play a part in identifying a recovering economy when analysed with job advertisements and projects, leading to higher demand in the sales market.
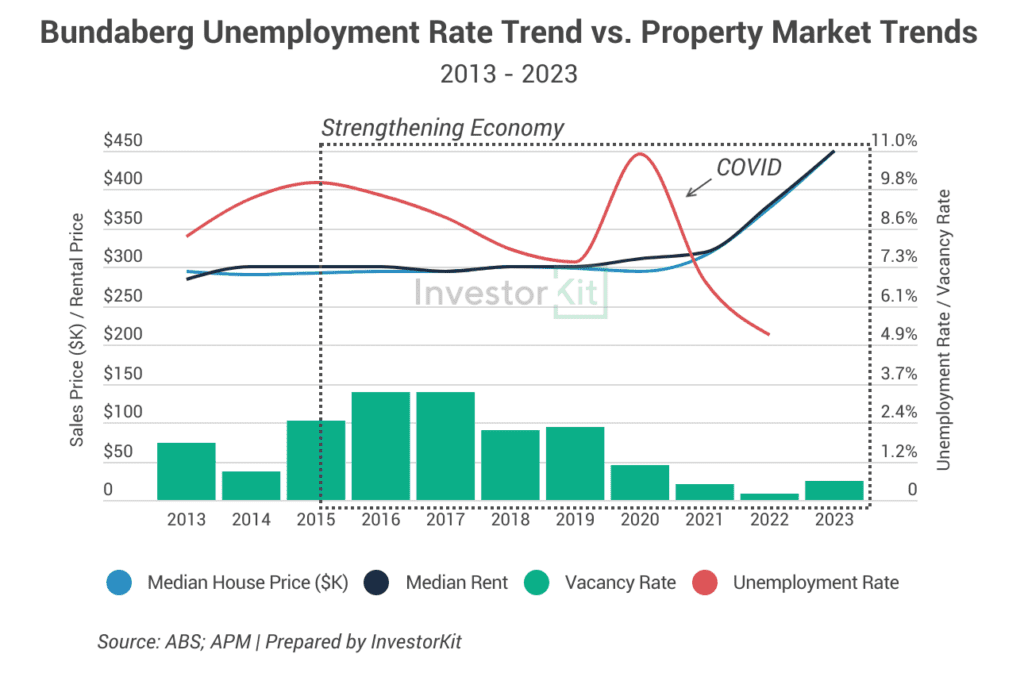
Bundaberg is an example.
Bundaberg’s unemployment rate peaked in 2015 and has been trending down since then (though COVID disturbed the decline in 2020), indicating a gradual recovery in the local economy. The recovery was reflected in rental vacancy rates almost immediately: A more active economy creates more jobs, and the new jobs attract new residents who absorb rental supply immediately, as renting tends to be the first choice (see chart below).
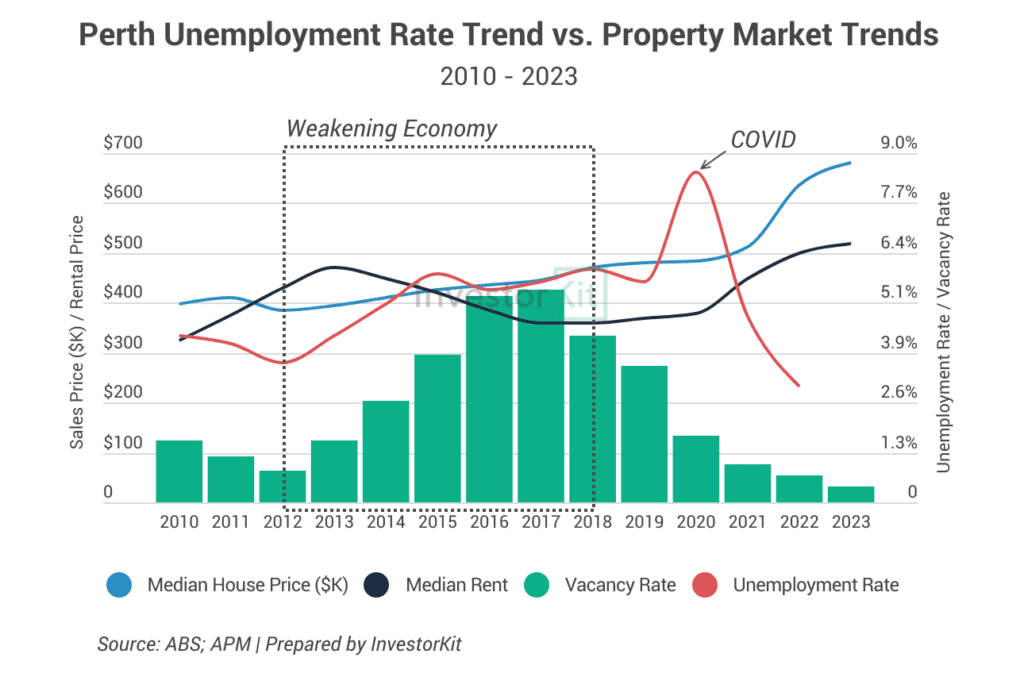
Similarly, rental declines and vacancy rate surges are signals of a weak economy. Perth’s rental price dropped, and the vacancy rate surged during its economic downturn (2012-18, chart below). The city’s house prices didn’t grow much during that period either. As the city’s economy recovers and vacancy rates decline to a crisis level, Perth has now become one of the hottest capital-city property markets.
This top tip is one of the rules in the 5 Rules For Investing During High Interest Environment, a whitepaper InvestorKit co-authored with Confidence Finance. Check it out for more tips to help you thrive on your property investment journey!
InvestorKit buyers’ agents focus on helping property investors achieve their investment goals faster. Our data-driven approach ensures that we always match you with markets, meeting your goals and requirements, no matter how the interest rates or any other market influencers move.
Would like to buy your next investment property with InvestorKit by your side? Talk to us today by clicking here and requesting your 15-min FREE discovery call!
.svg)
