Some investors say, “Property investment is a long-term game, so the market cycle position doesn’t matter much.”
Would you agree?
In the long term, almost all markets grow similarly in value (subject to the overall health of the local economy, though). In that sense, it seems that no matter where you buy, you’ll get the same, or very similar, capital growth in 30 years. You’d lose nothing long-term, even starting in a declining market.
However, do you really lose nothing?
In this blog, let’s figure out what it may cost you to buy far away from a strong growth cycle.
In the long term, all markets’ performances tend to converge as long as the economy is healthy.
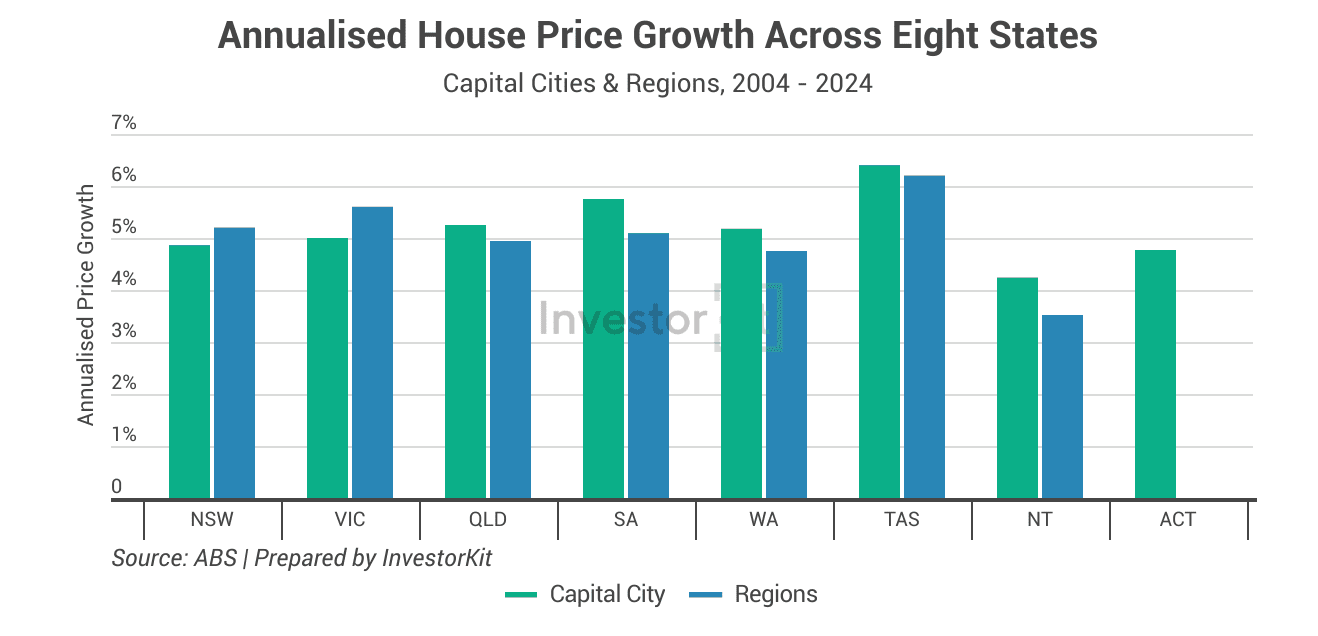
In the past twenty years, almost all house markets across Australia have achieved around 5% annualised value (price) growth, as shown in the chart below. The only two exceptions are Tasmania (6%+) and the Northern Territory (only 4%).
The convergence is more significant when the time frame is stretched to the past 30 years. Due to limited data availability, the chart below shows only the eight capital cities’ market performance data.
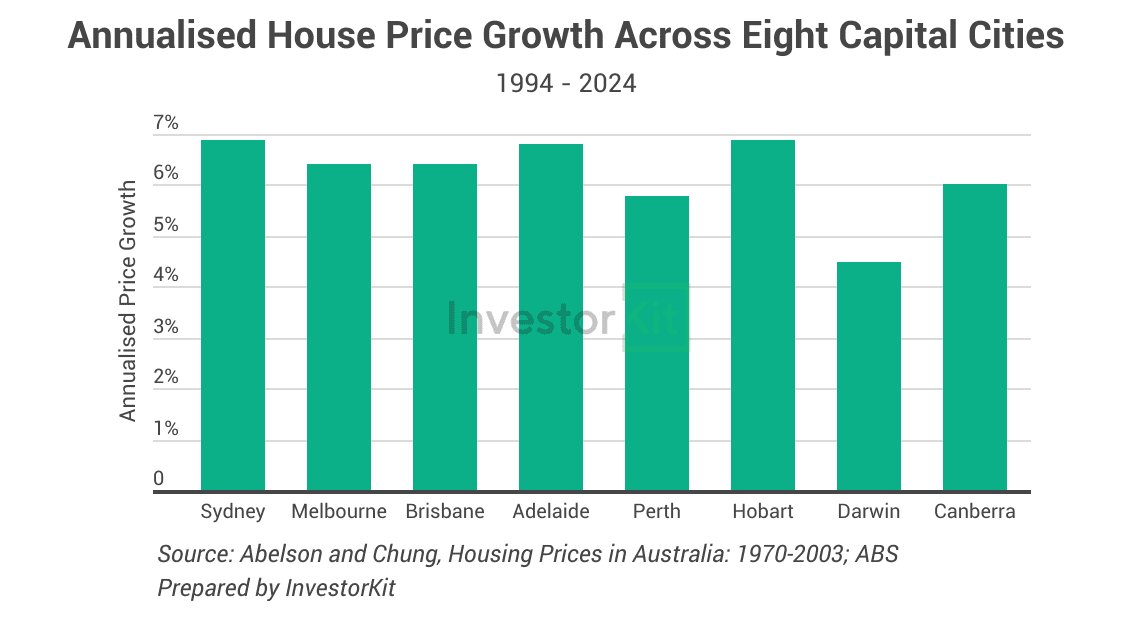
Most capital cities achieved 6-7% annual growth; only Darwin’s was lower than 5%. Darwin and the NT’s poorer performance is likely due to their local economies being not strong enough to support their housing demand growth.
Therefore, if we’re talking about the long-term growth of one property, it will make little difference whether you’re buying in Sydney, Adelaide, or Hobart, so long as you’re buying in a healthy economy.
However, you may lose the opportunity to accumulate equity and scale up your portfolio fast.
Compounding is powerful in portfolio building. The earlier you build a scaled portfolio, the more compound growth you’ll enjoy (check this blog for more details). Investors would love to to minimise their acquisition window (i.e., to build the desired portfolio as fast as possible and then stop buying).
A good strategy for buying fast is to utilise the equity gained from previous purchases: We would love our first few properties to be fast growers, gaining a good amount of equity in one or two years that can be withdrawn and used to buy the next one.
But if you buy in a slowly moving market far from a strong growth cycle, the property can barely help speed up your following purchases. As a result, you wouldn’t be able to minimise your acquisition window and maximise your compound growth—that’s the loss I’m talking about.
I better demonstrate with an example.
A purchase in Brisbane in 2013
In 2013, Brisbane had just emerged from its last trough and was not showing much heat yet. Assuming that our friend Joe entered the market that year, his purchase price would be lower than the 2010 peak, and he would have achieved 91% total value growth in the next 11 years up to 2024, which seems excellent (chart below).
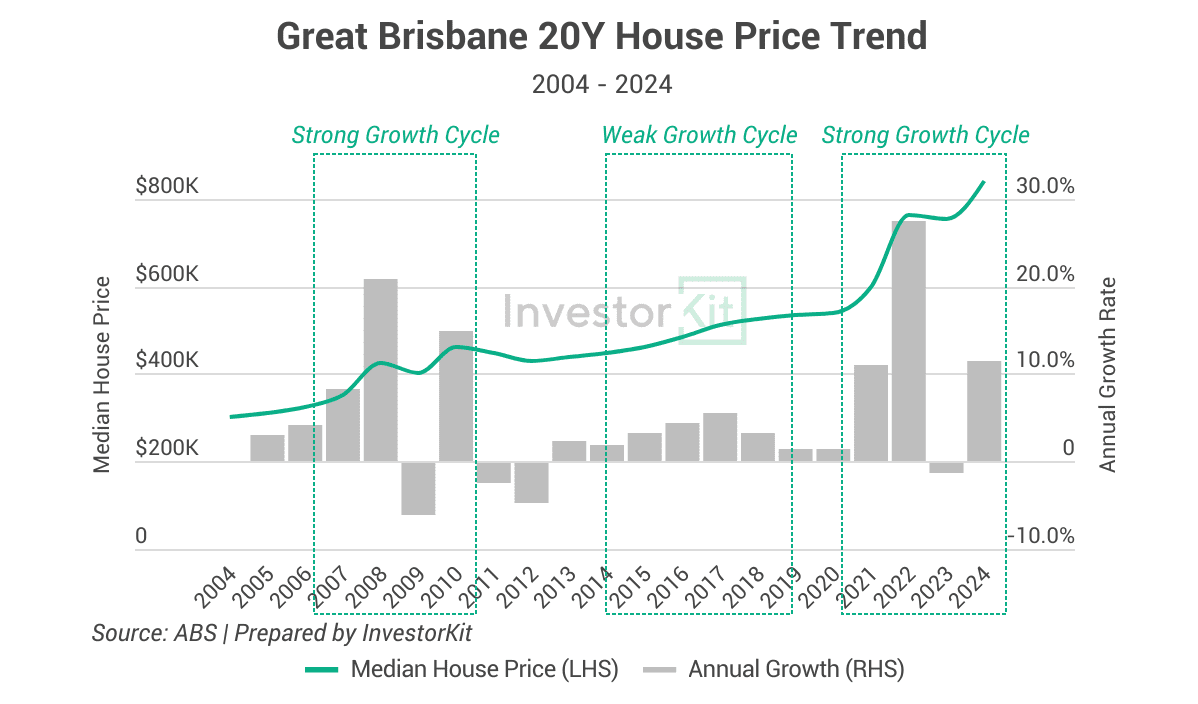
However, in the first two years of holding (2013-2015), he would only have achieved a total value growth of 5.2%, averaging 2.6% per year, much lower than the long-term average. Before the market started its strong growth cycle in 2021, he would only have achieved 23% total growth in 7 years (2013-2020), averaging just 3% per year.
What if Joe had bought in…
In comparison, with a similar, or even smaller, budget, if Joe had purchased in a market in or approaching a strong growth cycle, his short-term value growth would have been much higher. In 2013, New South Wales was moving into a strong growth cycle. The table below shows some areas he could have bought in (with Brisbane as a benchmark, equity gain is noted in the brackets):

If Joe bought in NSW instead of Brisbane, he could have made as much as $104,000 extra in equity in just the first 2 years! That’s easily the acquisition costs (including deposit, duties, fees, and even a bit of a buffer) of one more property!
Not just a few years lag: a slow start may lead to many years of catch-up
In the above chart, have you noticed that Brisbane’s total value growth has yet to catch up with the NSW cities? When you buy in a weak growth cycle, you would not just see lower equity growth in the first two years but may see your total value growth laging for many years before catching up with others.
The chart below shows the trajectory of house price growth in four cities from 2013 to 2024. Sydney and Melbourne each experienced a strong growth cycle before 2019, while Brisbane and Adelaide both experienced a weak growth cycle.
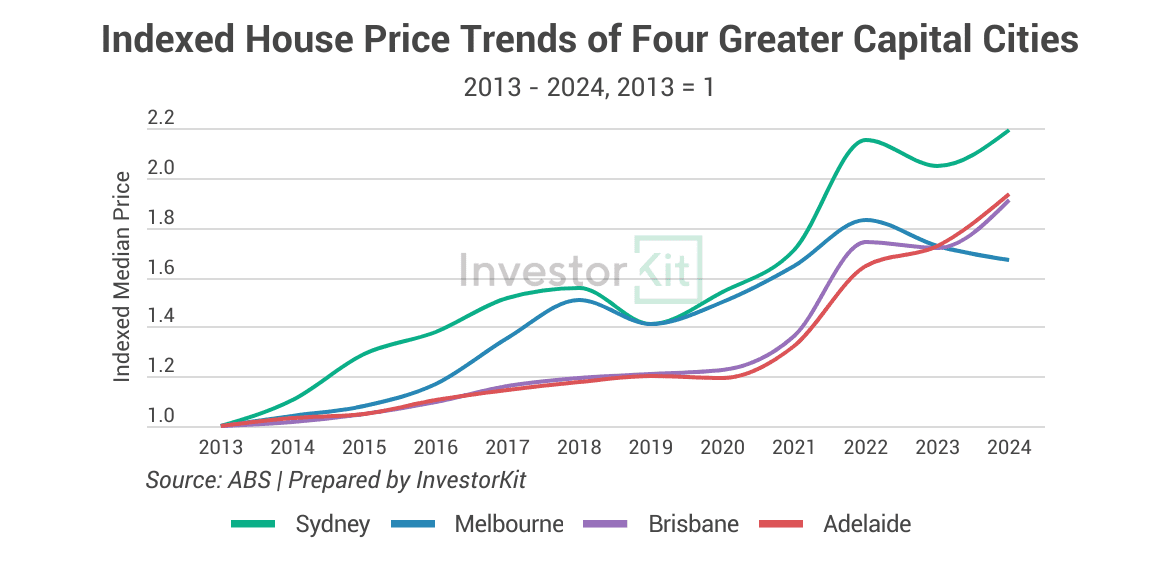
If you had bought an average property in Brisbane or Adelaide in 2013, it would likely take 10 years for that property’s total capital gain to catch up with Melbourne’s, and it might take it another few years to catch up with Sydney’s (now that Sydney is growing slower than Brisbane and Adelaide).
So, instead of waiting for your property to catch up with other markets after a decade, why not buy in those markets in the first place and enjoy 10 years of better growth?
If you agree with that, then our next question would be:
How to tell if you’re too far from a strong growth cycle?
By analysing market pressure.
If a market is under high pressure, it’s likely in a strong growth cycle or moving towards one. On the contrary, if a market is under low market pressure, it’s likely a bit far from the next strong growth cycle.
Now, the question has become how to analyse market pressure.
To examine market pressure, you want to look at a series of indicators across the local economy, the sales market, and the rental market. The sales market demand and supply indicators are the most essential, while the rest serve as supportive indicators.
Here are two capital cities to demonstrate: Perth and Hobart. One is in a strong growth cycle; the other is far away from it. The charts below will show you their differences.
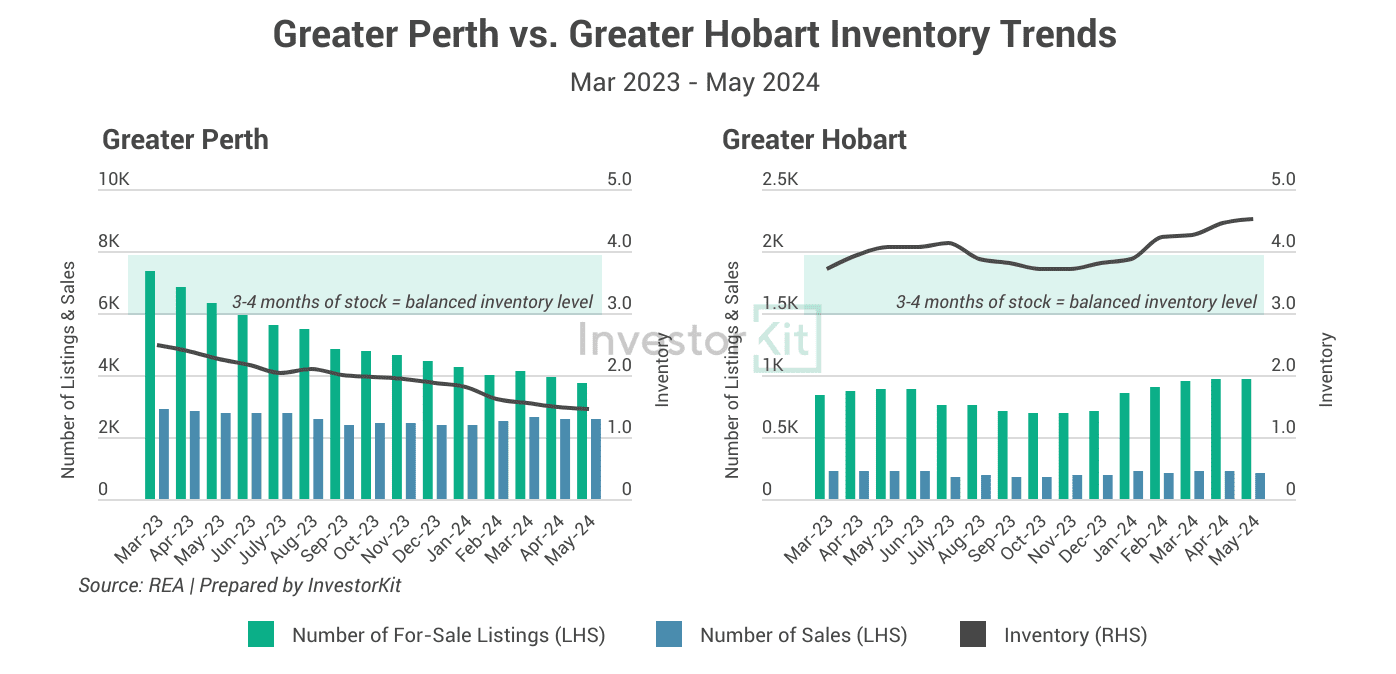
Perth’s for-sale supply has been falling rapidly while the sales volume stays relatively stable, leading to its inventory level consistently going down. It is currently much lower than the 3-4 months balanced level. The low and decreasing inventory indicates high market pressure.
In contrast, Hobart’s supply level has lifted while demand (sales volume) is not increasing. As a result, the inventory level continues to trend up, currently at 4.5, above the balanced level, and is not showing signs of decreasing. The high and increasing inventory indicates low market pressure.
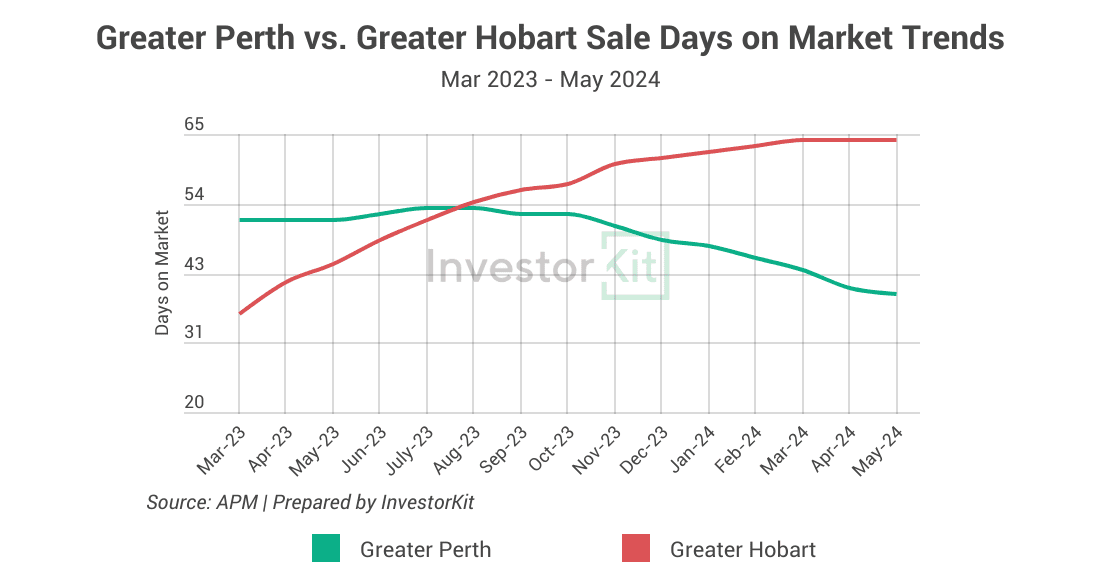
Besides inventory levels, sale days on market also contains information about market pressure (chart below).
- Over the past year or so, Perth houses’ sale days on market has been decreasing. Buyers have to make faster decisions to seize opportunities as demand increases fast relative to supply. The decreasing days on market indicates increasing market pressure.
- In contrast, Hobart houses’ sale days on market has increased significantly over the past two years. Buyers now have more time to make decisions and negotiate as demand has declined relative to supply. The lifted days on market indicates decreased market pressure.
Inventory levels and sale days on market are two major indicators you want to examine when assessing market pressure. Other indicators worth considering include unemployment rates, which reflect economic performance; internal/overseas migration trends, which reflect underlying housing demand; vacancy rates, which show the demand and supply dynamics in the rental market, and many more.
[Our city-by-city market pressure review blog series shows more details of how we examine market pressure. Find them here, by looking for “Market Pressure Review: xxx(city name) in 10 Charts”!]
Buying in a high-pressure market allows you to enjoy the fast short-term capital gain of a strong growth cycle and puts you in an advantageous position in your portfolio-building journey.
So, in a nutshell, do you lose anything buying far away from a strong growth cycle? No, if we’re talking about a single property held for 20, 30 years or longer. However, you may lose fast value growth in the short term and the consequential opportunity to build a scaled portfolio faster.
InvestorKit is a data-driven buyers agency dedicated to helping property investors identify and invest in high-pressure markets to quickly scale up their portfolios and fast-track their property investment journey. Would you like to speed up your portfolio-building process like a pro? Get in touch today for a free, no-obligation 15-minute discovery call!
.svg)
